SQL for Data Analytics & Data Analysis: A Complete Beginner's Guide (2026)
Ask any working data analyst what the single most important skill in their toolkit is, and nine out of ten will say the same thing: SQL. Before Python, before Power BI, before Tableau, SQL is the language that actually gets you into the data. It's the foundation every real data analytics career is built on, and it's the one skill that appears in virtually every data analytics jobs listing in Nepal and internationally.
This guide covers everything a beginner needs: sql meaning, sql full form, how to do a sql download or use a sql compiler online, every critical sql commands category, and exactly how SQL fits your broader data analytics roadmap including career, salary, and training options in Nepal.
If you haven't read our foundational pieces yet, what is data analytics and data analytics vs data science are the right starting point before diving into a specific tool like SQL.
What Is SQL? (SQL Meaning, SQL Full Form, SQL Definition)
SQL full form is Structured Query Language: It's the standard language used to communicate with relational databases systems that store data in organized tables of rows and columns, much like a highly structured Excel workbook but capable of holding billions of records.
- SQL meaning in plain terms: it's how you ask a database a question. You write a query, the database runs it, and it hands back exactly the data you asked for filtered, sorted, grouped, and calculated, all in one step.
- SQL definition from a technical standpoint: SQL is a declarative programming language, meaning you describe what data you want, not how the computer should find it. The database engine handles the "how," which is why SQL is accessible even for people with no coding background.
SQL was developed at IBM in the early 1970s, standardized by ANSI in 1986, and is now the most widely used database language in the world. It powers everything from the banking system your salary lands in to the e-commerce platform you order from.
What Is a SQL Database?
A sql database is a collection of structured data organized into related tables. Each table has columns (attributes, like "customer_name" or "order_date") and rows (individual records, like each individual transaction).
What makes a relational sql database powerful is the ability to link tables together. Instead of one massive spreadsheet, you have many smaller, clean tables a Customers table, an Orders table, a Products table all connected through shared keys. SQL lets you combine and query across all of them simultaneously.
Common SQL database systems used in data analytics include:
- MySQL the world's most popular open-source database, widely used by web applications and startups
- PostgreSQL open-source, highly standards-compliant, excellent for analytical workloads
- Microsoft SQL Server the enterprise standard in banking, corporate IT, and large Nepali organizations
- SQLite file-based, requires zero server setup, perfect for learning and local development
- Oracle Database dominant in large financial institutions globally
SQL Types: The Five Command Categories
SQL types are organized by what the commands do to the database. Every SQL command you'll ever write falls into one of five categories:
| Category | Full Name | What It Does | Key Commands |
|---|---|---|---|
| DDL | Data Definition Language | Defines and modifies database structure | CREATE, ALTER, DROP, TRUNCATE |
| DML | Data Manipulation Language | Adds, updates, or deletes data | INSERT, UPDATE, DELETE |
| DQL | Data Query Language | Retrieves data for analysis | SELECT |
| DCL | Data Control Language | Manages access and permissions | GRANT, REVOKE |
| TCL | Transaction Control Language | Controls transaction behavior | COMMIT, ROLLBACK, SAVEPOINT |
For sql for data analytics, you'll spend 90% of your time in DQL (writing SELECT queries) and DML (cleaning and transforming data). DDL matters when setting up practice databases. DCL and TCL are more relevant once you're working inside a production database environment at a company.
SQL Download: How to Set Up SQL on Your Computer
There are two main options: install SQL locally (more control, better for serious learning) or use a sql compiler online (instant access, zero setup). Both work. Here's the guide for each.
Option 1: SQL Download & Local Installation
SQL Server Download (Microsoft SQL Server best for corporate environments)
- Microsoft SQL Server is the most common database in large Nepali IT companies, banks, and enterprises. The free Developer Edition is fully featured for learning and personal use:
- Go to the Microsoft SQL Server downloads page
- Select "Developer" edition (free for non-production use)
- Follow the installer default settings work for beginners
- After installation, download SQL Server Management Studio (SSMS) the GUI tool you'll use to write and run queries
SQL Management Studio Download (SSMS)
SQL Server Management Studio is the official desktop interface for working with SQL Server. It's separate from SQL Server itself:
- Search "SQL Server Management Studio download" on Microsoft's official site, or navigate to the SSMS download page via the SQL Server installer's "Install SSMS" link
- Install SSMS, then connect it to your local SQL Server instance
- You're ready to write your first query
MySQL Download
MySQL is the most popular choice globally for web developers and startups:
- Visit mysql.com/downloads and select "MySQL Community Server"
- Choose the installer for Windows; Mac users can use Homebrew (brew install mysql)
- Pair with MySQL Workbench the free GUI tool for a full visual development environment
SQLite Download
SQLite is the simplest starting point for absolute beginners. There's no server, no installation complexity it's just a single file on your computer:
- Visit sqlite.org/download.html and download the precompiled binary for your OS
- Pair it with DB Browser for SQLite a free, beginner-friendly GUI
- Load any CSV file as a database and start querying immediately
SQLite is what powers mobile apps (including many apps on your phone), embedded systems, and local development environments. It's the lowest-friction way to start practicing SQL today.
Option 2: SQL Compiler Online (No Installation Required)
If you want to practice immediately with zero setup, these sql online platforms and sql online editor tools let you write and run queries directly in your browser:
| Tool | Best For | Database | Link |
|---|---|---|---|
| SQLiteOnline.com | Absolute beginners, CSV uploads | SQLite | sqliteonline.com |
| DB Fiddle | Testing and sharing queries | MySQL, PostgreSQL, SQLite | db-fiddle.com |
| SQL Fiddle | Quick syntax testing | Multiple | sqlfiddle.com |
| W3Schools SQL Editor | Following along with tutorials | MySQL-like | w3schools.com |
| Mode Analytics SQL Editor | Real business datasets, intermediate | PostgreSQL | mode.com |
| BigQuery Sandbox | Large datasets, advanced | Google SQL | cloud.google.com/bigquery |
For Nepal-based beginners with slower internet connections, SQLiteOnline.com is the most reliable it runs entirely in the browser with no heavy cloud dependency.
What Is a SQL Developer Role?
A sql developer is a professional who designs, builds, and maintains databases and writes SQL queries to support business applications and data needs. In Nepal's IT sector, SQL developer roles sit across two tracks:
- Backend/application focus building and optimizing the databases that power web and mobile applications (common at software companies)
- Analytics focus writing complex queries, building reporting layers, and supporting BI tools like Power BI (common at banks, telecoms, and data-driven companies)
For a data analytics career path, you don't need to become a full SQL developer. You need strong query-writing skills SELECT, JOINs, aggregations, window functions and the ability to work independently with large datasets to answer business questions.
SQL for Data Analysis: The Core Commands Every Analyst Needs
This section covers the sql commands that matter most in real data analysis work, from the most basic to the most powerful.
1. SELECT The Foundation of All Data Retrieval
Every SQL data analysis query starts with SELECT. It tells the database what columns you want to see.
-- Basic SELECT: show customer name and total purchase from the sales table
SELECT customer_name, total_purchase
FROM sales
WHERE total_purchase > 10000
ORDER BY total_purchase DESC
LIMIT 10;
This single query answers a real business question: "Who are my top 10 customers by purchase value?" That's data analysis in its simplest form filtering, sorting, and surfacing the most useful records.
2. Aggregate Functions Turning Rows into Insights
The jump from looking at raw records to summarizing patterns is where SQL becomes genuinely powerful for data analytic work.
-- Monthly revenue summary by product category

SELECT

    product_category,

    COUNT(*) AS total_orders,

    SUM(sale_amount) AS total_revenue,

    AVG(sale_amount) AS avg_order_value,

    MAX(sale_amount) AS largest_order

FROM sales

WHERE sale_date >= '2026-01-01'

GROUP BY product_category

HAVING SUM(sale_amount) > 50000

ORDER BY total_revenue DESC;

Key aggregate functions every data analytics beginner must know:

COUNT() how many recordsSUM() total valueAVG() average valueMAX() / MIN() highest and lowest valueGROUP BY creates separate buckets for each category before aggregatingHAVING filters after aggregation (WHERE filters individual rows; HAVING filters grouped results)
3. JOINs Combining Data Across Multiple Tables
Real business data never lives in a single table. A sql database at a Nepali bank will have a Customers table, a Loans table, a Transactions table, and a Branches table and you'll need to combine all of them to answer a question like "Which branch has the highest default rate on loans issued to customers under 30?"
-- Customer loan performance by branch

SELECT

    b.branch_name,

    c.age_group,

    COUNT(l.loan_id) AS total_loans,

    SUM(CASE WHEN l.status = 'Defaulted' THEN 1 ELSE 0 END) AS defaults,

    ROUND(100.0 * SUM(CASE WHEN l.status = 'Defaulted' THEN 1 ELSE 0 END) / COUNT(l.loan_id), 2) AS default_rate_pct

FROM customers c

INNER JOIN loans l ON c.customer_id = l.customer_id

INNER JOIN branches b ON l.branch_id = b.branch_id

WHERE c.age_group = 'Under 30'

GROUP BY b.branch_name, c.age_group

ORDER BY default_rate_pct DESC;
The four JOIN types every analyst needs to understand:
| JOIN Type | What It Returns |
|---|---|
| INNER JOIN | Only rows with matches in both tables |
| LEFT JOIN | All rows from the left table + matched rows from the right (NULLs where no match) |
| RIGHT JOIN | All rows from the right table + matched rows from the left |
| FULL JOIN | All rows from both tables, NULLs where no match |
For most analytical queries, INNER JOIN and LEFT JOIN cover 95% of use cases.
4. Window Functions The Most Powerful Tool for Analysts
Window functions are what separate a basic SQL user from a capable data analytics specialist. They let you perform calculations across a set of related rows without collapsing them into a single summary perfect for running totals, ranking, and period-over-period comparisons.
-- Monthly sales with running total and month-over-month growth

SELECT

    sale_month,

    monthly_revenue,

    SUM(monthly_revenue) OVER (ORDER BY sale_month) AS running_total,

    LAG(monthly_revenue) OVER (ORDER BY sale_month) AS prev_month_revenue,

    ROUND(

        100.0 * (monthly_revenue - LAG(monthly_revenue) OVER (ORDER BY sale_month))

        / LAG(monthly_revenue) OVER (ORDER BY sale_month), 2

    ) AS mom_growth_pct

FROM monthly_sales

ORDER BY sale_month;

Key window functions:


ROW_NUMBER() assigns a unique sequential number to each rowRANK() / DENSE_RANK() ranks rows, with ties handled differentlySUM() OVER (...) running or partitioned totalsLAG() / LEAD() accesses the previous or next row's valueAVG() OVER (ROWS BETWEEN ... AND ...) rolling/moving averages
5. CTEs (Common Table Expressions) Writing Readable, Maintainable Queries
As sql for data analysis queries get more complex, Common Table Expressions (CTEs) let you break them into readable, logical steps like writing a recipe instead of a single run-on sentence.
-- Customer segmentation using CTEs

WITH customer_summary AS (

    SELECT

        customer_id,

        COUNT(order_id) AS total_orders,

        SUM(order_amount) AS lifetime_value,

        MAX(order_date) AS last_order_date,

        CURRENT_DATE - MAX(order_date) AS days_since_purchase

    FROM orders

    GROUP BY customer_id

),

customer_segments AS (

    SELECT

        customer_id,

        lifetime_value,

        CASE

            WHEN days_since_purchase <= 30 AND lifetime_value > 50000 THEN 'VIP Active'

            WHEN days_since_purchase <= 30 THEN 'Active'

            WHEN days_since_purchase <= 90 THEN 'At Risk'

            ELSE 'Churned'

        END AS segment

    FROM customer_summary

)

SELECT segment, COUNT(*) AS customers, ROUND(AVG(lifetime_value), 0) AS avg_value

FROM customer_segments

GROUP BY segment

ORDER BY avg_value DESC;
This is a real data analytics project pattern customer segmentation by recency and value that appears in e-commerce, banking, and telecom analytics work across Nepal.
What Is Data Analytics? Where SQL Fits the Bigger Picture
Data analytics meaning: the process of examining datasets to draw conclusions about the information they contain, with the goal of guiding business decisions. What is data analytic work in practice? It's the cycle of collecting data, cleaning it, analyzing it, and communicating findings to decision-makers.
SQL is the engine at the center of what is data analysis process specifically the extraction, cleaning, and aggregation stages. Here's how the full data analytics process breaks down and where SQL is active:
- Data collection connecting to databases, importing CSVs, querying APIs (SQL involved)
- Data cleaning handling NULLs, removing duplicates, fixing inconsistencies (SQL heavily involved)
- Data analysis aggregating, joining, grouping, modeling (SQL is the primary tool)
- Data visualization turning query results into charts and dashboards (SQL feeds Power BI, Tableau, etc.)
- Communication presenting insights to stakeholders (SQL output informs the narrative)
What is data analysis for business concretely? It's using this process to answer questions that affect revenue, cost, customers, and operations the kind of questions that get asked in every board meeting and every department strategy session.
Data Analytics Tools: Where SQL Sits in the Stack
Data analytics software and data analytics tools form a layered stack, and SQL is the foundation everything else is built on. Understanding data analytics software tools as a system not just individual products is one of the things that distinguishes a thoughtful data analytics specialist from someone who just knows a few commands.
| Layer | Tools | Role |
|---|---|---|
| Storage & Querying | SQL (MySQL, PostgreSQL, SQL Server, SQLite, BigQuery) | Where data lives and how you get it out |
| Processing & Cleaning | SQL, Python (pandas), Excel | Preparing data for analysis |
| Analysis & Modeling | SQL (window functions, CTEs), Python (scikit-learn, statsmodels), R | Finding patterns, building models |
| Visualization & BI | Power BI, Tableau, Google Looker Studio, Excel | Communicating findings visually |
| AI & Automation | Python, SQL + AI integrations, Power BI Copilot | Automating analysis and scaling insight |
SQL connects to every layer. Power BI's data modeling engine runs DAX on top of a SQL-like relational model. Python's pandas library mirrors SQL operations (merge = JOIN, groupby = GROUP BY). Even AI in data analytics tools work on top of structured data that SQL organizes and prepares.
For a deeper look at how data visualization fits into this stack and how SQL query results become charts, our data visualization guide covers that in full. And if you want to understand what business intelligence is as a discipline where SQL-fed dashboards and KPI systems live that's the next logical read after this post.
SQL for Data Analysis: Real-World Business Use Cases
What is data analytics for business in Nepal's context specifically? Here are real data analytics business applications where SQL is the primary tool being used today:
- Banking & Microfinance: Querying loan performance tables to monitor NPL (Non-Performing Loan) ratios by branch, officer, and borrower category. Running monthly regulatory reports by aggregating transaction data across accounts.
- Telecom (Nepal Telecom, Ncell, Smart Cell): Analyzing call data records (CDRs) to detect churn risk, customer ARPU trends, and recharge pattern anomalies. SQL handles these datasets at millions of rows per day.E-commerce & Retail: Customer segmentation queries, cart abandonment analysis, inventory forecasting based on historical sell-through rates.
- NGOs & Development Organizations: Monitoring and evaluation (M&E) data aggregation for donor reports one of the most SQL-heavy environments in Nepal's job market.
- IT Companies (product and service): Backend teams use SQL for application database management; analytics teams use it to analyze user behavior and product KPIs.
Every one of these applications is a potential data analytics project for your portfolio and a potential employer looking for data analytics courses in nepal-trained candidates with real SQL skills.
SQL Practice: How to Actually Get Good
Knowing SQL syntax is one thing. Being able to sit down with a messy, unfamiliar dataset and produce clean, useful analysis in a reasonable time is the skill employers test. SQL practice is the only path between the two.
Structured practice path for beginners (8 weeks):
- Weeks 1–2: SELECT, WHERE, ORDER BY, LIMIT, basic filtering operators. Goal: answer simple "show me" questions on any dataset.
- Weeks 3–4: GROUP BY, aggregate functions, HAVING. Goal: build summary tables and KPI snapshots.
- Weeks 5–6: INNER JOIN, LEFT JOIN, multi-table analysis. Goal: combine two or three tables to answer business questions.
- Weeks 7–8: Window functions (ROW_NUMBER, LAG, SUM OVER), CTEs, subqueries. Goal: build a working data analytics project with period-over-period analysis.
Free practice datasets for beginners:
- Northwind Database (classic sales/orders/customers dataset, perfect for JOIN practice)
- Sakila Database (DVD rental store, complex relationships, advanced query practice)
- Nepal Open Data Portal (real Nepali government datasets for local context)
- Kaggle public datasets (thousands of real-world datasets across every industry)
SQL practice platforms:
- SQLZoo beginner-friendly, interactive, browser-based
- HackerRank SQL structured challenges ranked by difficulty, good for interview prep
- LeetCode SQL harder, used specifically to prepare for data analytics job interviews
- Mode Analytics real business datasets, more applied analytical context
- W3Schools SQL the most beginner-accessible sql tutorial resource for syntax reference
The single best habit: spend 20–30 minutes daily writing queries on a real dataset rather than following a tutorial passively. Active querying builds instinct that passive watching doesn't.
Data Analytics Roadmap: Where SQL Fits Your Learning Path
A complete data analytics roadmap for a job-ready analyst in Nepal, with SQL's position clearly marked:
Stage 1 Foundations
- Excel (data manipulation, pivot tables, basic formulas)
- Basic statistics (mean, median, standard deviation, correlation)
- Data literacy (understanding data types, sources, and business context)
Stage 2 Core Technical Skills ← SQL lives here
- SQL (querying, cleaning, aggregating, joining the entire foundation of data work)
- Power BI or Tableau (turning SQL query output into dashboards covered in our Power BI for Beginners guide)
Stage 3 Analytical Depth
- Python (pandas for advanced data manipulation, matplotlib/seaborn for visualization, scikit-learn for predictive modeling)
- Advanced SQL (window functions, query optimization, CTEs, stored procedures)
Stage 4 Specialization
- AI-integrated analytics (using LLMs and AI tools alongside SQL and Python)
- Domain expertise (banking data, NGO M&E data, e-commerce analytics)
- Business communication (presenting findings to leadership)
SQL is the non-negotiable gate between Stage 1 and Stage 3. You cannot effectively use Python for data analysis, you cannot build meaningful Power BI models, and you cannot work with real company databases without SQL.
Data Analytics Salary in Nepal: What SQL Skills Are Worth
Salary data cross-referenced from Kumarijob, NecoJobs, and live job postings (verified mid-2026):
| Level | Experience | Monthly Salary (NPR) | SQL Role |
|---|---|---|---|
| Entry-level Data Analyst | 0–1 years | 30,000–60,000 | Basic SELECT, filters, aggregations |
| Mid-level Data Analyst | 1–3 years | 60,000–100,000 | JOINs, window functions, dashboard integration |
| Senior Data Analyst | 3–5 years | 100,000–150,000 | Query optimization, complex modeling, team mentorship |
| Data Analytics Specialist / Lead | 5+ years | 150,000+ | Architecture, strategic analytics, AI integration |
The biggest salary jump in Nepal's analytics market from the NPR 40,000–60,000 range to the NPR 80,000–100,000+ range consistently correlates with two skills: SQL proficiency beyond basic queries (window functions, CTEs, multi-table JOINs) and the ability to build production dashboards in Power BI. These are the two skills that move a data analytics intern into a mid-level data analyst role.
Data analytics remote jobs note: SQL is one of the most universal skills for remote work internationally. Nepali analysts with verifiable SQL portfolio projects regularly land remote roles at international companies paying USD 800–2,000/month significantly above local market rates.
Data Analytics Courses in Nepal: What to Look For
Whether you're searching for data analytics courses, data analytics free courses, or a structured data analytics full course in Nepal, the most important filter is this: does it teach SQL using real, messy business datasets rather than perfectly clean tutorial files?
Data analytics free courses worth starting with:
- SQLZoo interactive SQL exercises in the browser, genuinely free
- W3Schools SQL Tutorial the most-used sql tutorial reference online, fully free
- Google's Data Analytics Certificate on Coursera free to audit, covers SQL basics alongside spreadsheets and visualization
- Mode SQL Tutorial free, analytical focus with real business datasets
Where free courses fall short: they build vocabulary but not portfolio-ready projects. They don't replicate the experience of sitting down with a company's actual messy database and producing analysis under real constraints. That's the gap structured data analytics training closes.
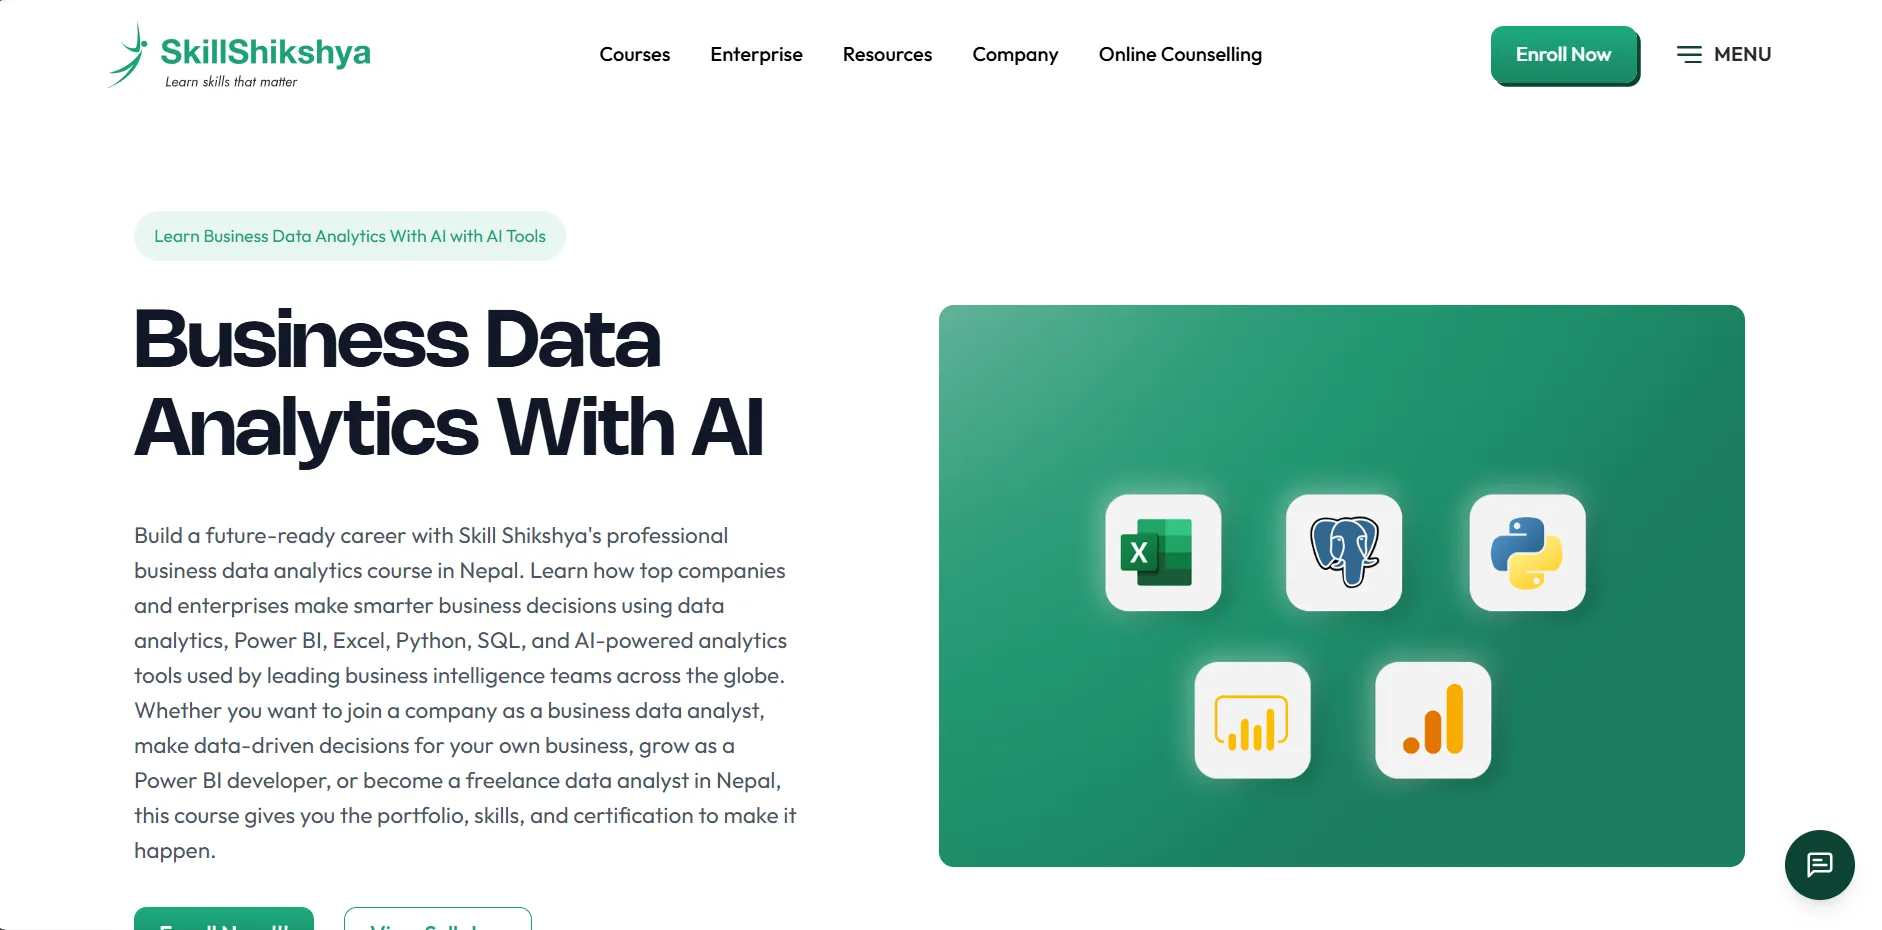
If you're looking for a data analytics course in nepal that covers SQL in the context of a full analytics stack Excel, SQL, Power BI, Python, and AI tools rather than as an isolated topic, Skill Shikshya's Business Data Analytics with AI course is built around exactly that: real datasets, portfolio project guidance, and the full data analytics process from raw data to boardroom-ready dashboard.
This is also the curriculum referenced by our career guide to becoming a data analyst as the structured path for Nepal-based students and professionals making the transition into a data analytics career.
For anyone interested in the broader business analytics in nepal landscape how business data analytics as a discipline is growing across Kathmandu's fintech, banking, and IT sectors the business analytics course in nepal pathway is covered in our data analytics vs business analytics guide.
What Does a Data Analyst Actually Do? (SQL Edition)
A day in the life of a working data analyst in a mid-sized Kathmandu IT or fintech company looks something like this:
- Morning: Pull last night's transaction data using a scheduled SQL query. Flag any anomalies unusually high values, duplicate records, timestamp errors using HAVING and window functions. Send an automated daily summary to management.
- Midday: A product manager asks: "Which users signed up last quarter but have never completed an order?" Write a LEFT JOIN query across the users and orders tables to find the cohort. Feed the result into a Power BI segment filter.
- Afternoon: Build a monthly churn analysis using CTEs to calculate days-since-last-activity per user, segment into active/at-risk/churned buckets, and export to a dashboard stakeholders can filter themselves.
- End of day: Prep the weekly SQL query for the finance team's revenue reconciliation report. This is a 15-table JOIN across the payment, refund, discount, and product tables. You wrote it once three months ago; now you just update the date filter and run it.
This is what is data analyst do in practice: SQL is the constant. The questions change, the datasets change, but the tool stays the same.
Frequently Asked Questions
What is SQL and why is it important for data analytics?
What is the SQL full form?
Which SQL database should a beginner start with?
Is there a way to practice SQL without downloading anything?
What is data analytics?
What is data analysis for business?
How long does it take to learn SQL for data analytics?
What is the data analytics salary in Nepal?
Are data analytics and business analytics the same?
Where can I find a data analytics course near me in Nepal?
About Author: