Power BI for Beginners What Is It, How to Download & Use It (2026 Guide) | Skill Shikshya
If you've started exploring how to become a data analyst, one name keeps showing up everywhere: Power BI. It's the single most requested skill in data analyst job postings in Nepal, and for good reason. This guide answers the basic question, power bi what is it, walks you through the power bi desktop download process, and shows you exactly how to build your first dashboard, with zero prior experience required.
This is one part of our complete data analytics learning series. If you haven't yet, it's worth starting with what is data analytics and data analytics vs data science to understand where a tool like Power BI fits into the bigger picture before diving into the tool itself.
What Is Power BI? (Power BI Meaning)
Power BI meaning, in the simplest terms: it's a free business intelligence (BI) tool built by Microsoft that connects to your data, helps you clean and organize it, and turns it into interactive charts, reports, and dashboards that anyone can understand at a glance.
Think of it as the upgrade path from Excel. Excel is great for working with a few hundred rows in a spreadsheet. Power BI is built for connecting to multiple data sources at once, whether that's an Excel file, a SQL database, Google Analytics, or a live company database, and building visuals that update automatically as the underlying data changes.
Power BI is made up of three core parts:
- Power BI Desktop: The free Windows application where you build reports and dashboards
- Power BI Service: The cloud platform (app.powerbi.com) where you publish, share, and collaborate on reports online
- Power BI Mobile: Apps for iOS and Android so you can view dashboards on the go
What Is Power BI Used For?
Power BI is a business intelligence tool used to track Key Performance Indicators (KPIs), uncover trends in business data, and help organizations make decisions backed by evidence instead of guesswork. In practice, that means:
- A retail business tracking daily sales by branch and product category
- A bank monitoring loan approval rates and customer churn
- An NGO reporting on program outcomes for donors
- A marketing team comparing campaign ROI across channels
- A startup founder watching revenue, expenses, and growth metrics in one place
This is exactly the kind of business data analysis work that sits at the center of almost every real-world analytics workflow, especially as AI-powered features get built into data analytics tools like Power BI itself.
Power BI Download: How to Get Power BI Desktop
Getting started costs nothing. Here's the correct way to do a power bi desktop download:
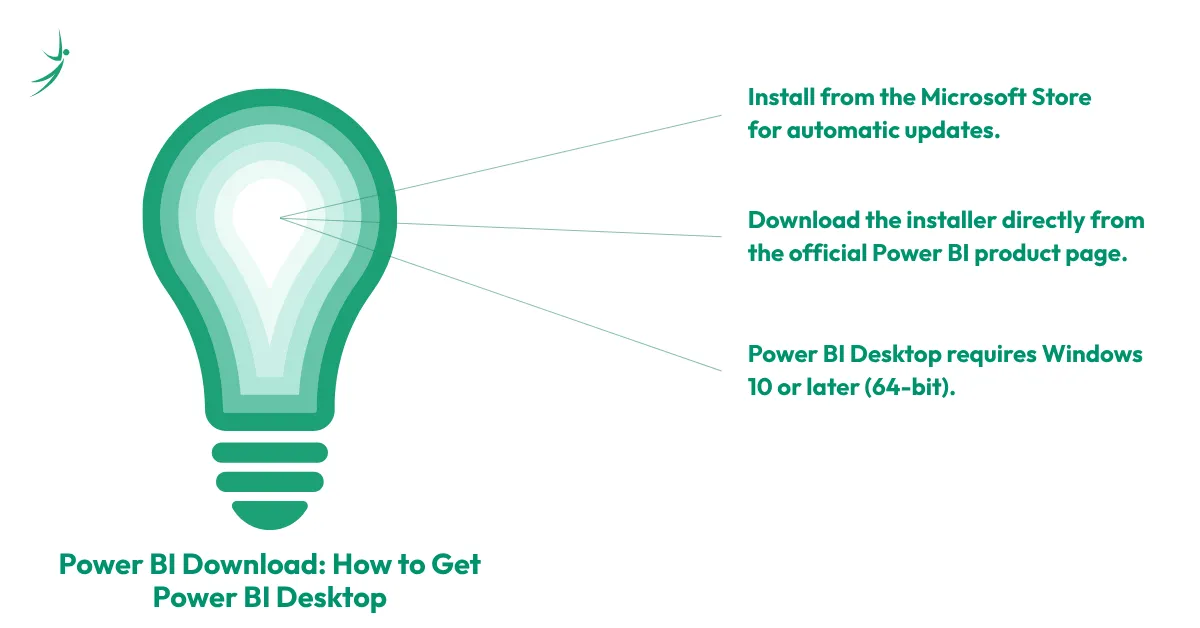
- Recommended method: Go to the Microsoft Store on Windows and search "Power BI Desktop." Installing this way means Windows handles monthly updates automatically, no manual reinstalls needed.
- Alternative method: Visit the official Power BI product page and select "Download free." This pulls the installer directly from the Microsoft Download Center.
- System requirement: Power BI Desktop only runs on Windows 10 or later (64-bit). Mac users can access full functionality through Power BI Service in a browser, or by running Windows in a virtual machine.
Avoid downloading Power BI Desktop from any third-party site. Only use the Microsoft Store or the official Microsoft product page, anything else is a security risk.
Once installed, opening the app for the first time shows a blank report with a few key areas: the Ribbon (top toolbar), the Canvas (your design area), the Visualizations pane, and the Fields pane, where your data tables live once imported.
Power BI Login and Power BI Online: Desktop vs Service
A lot of beginners confuse "downloading Power BI" with "logging into Power BI," so here's the difference:
- Power BI Desktop doesn't require a Power BI login to build reports locally on your computer. It works offline.
- Power BI Service (sometimes searched as Power BI Online) is the cloud platform at app.powerbi.com. This is where you do need to sign in with a Microsoft work or school account to publish, share, and collaborate on dashboards with a team.
The typical workflow: build your report in Power BI Desktop, then click "Publish" to push it to Power BI Service, where colleagues can view and interact with it through a browser or the mobile app, without needing Power BI Desktop installed themselves.
Power BI for Personal Use: Is It Really Free?
Yes, and this is one of the most underrated facts about the tool. Power BI for personal use is completely free through Power BI Desktop. You can connect to your own data, build full reports with every visualization type, and use the entire DAX formula language at no cost, as long as you're not sharing reports through Power BI Service.
The free tier is genuinely useful for:
- Personal finance tracking and budgeting dashboards
- Small business owners tracking their own sales and expenses
- Students and job-seekers building a portfolio of Power BI projects
- Freelancers reporting results to individual clients (exported as PDF or PowerPoint)
The limitation only kicks in when you need to share interactive, live-updating reports with other people inside an organization, that's when a paid license becomes necessary.
Power BI Pricing: Free vs Pro vs Premium (2026)
Here's where most beginner guides get outdated fast, since Microsoft updated pricing in April 2025. As of 2026, the current tiers are:
| Plan | Price | Best For |
|---|---|---|
| Power BI Desktop (Free) | $0 | Individual learning, personal dashboards, portfolio projects |
| Power BI Pro | $14/user/month (billed annually) | Small teams sharing and collaborating on reports |
| Power BI Premium Per User (PPU) | $24/user/month (billed annually) | Advanced analysts needing larger datasets, more frequent refreshes, and paginated reports |
| Microsoft Fabric Capacity (F-SKUs) | From roughly $263/month, scales with capacity | Enterprises needing organization-wide sharing without per-user licenses |
For anyone learning Power BI in Nepal, whether as a student or a working professional, the free Desktop version is more than enough to build a strong portfolio and pass technical interviews. You won't need a paid license until you're working inside a company that requires shared, cloud-hosted dashboards. You can find more details in a business data analytics course in Nepal.
Power BI Dashboard vs Power BI Report: What's the Difference?
These two terms get used interchangeably, but they're not the same thing.
- A Power BI report is a multi-page collection of visuals built around a single dataset, with full interactivity: you can filter, drill down, and explore the underlying data.
- A Power BI dashboard is a single-page, high-level summary that can pull individual visuals (called "tiles") from multiple different reports and datasets. Dashboards exist only in Power BI Service, not in Desktop, and they're designed for at-a-glance monitoring rather than deep exploration.
In short: you build reports in Desktop, and you pin pieces of those reports onto dashboards once published to the Service.
Power BI Visuals: The Building Blocks of Every Dashboard
Power BI visuals are the individual charts, graphs, and elements you drag onto the canvas to represent your data. The most commonly used visuals include:
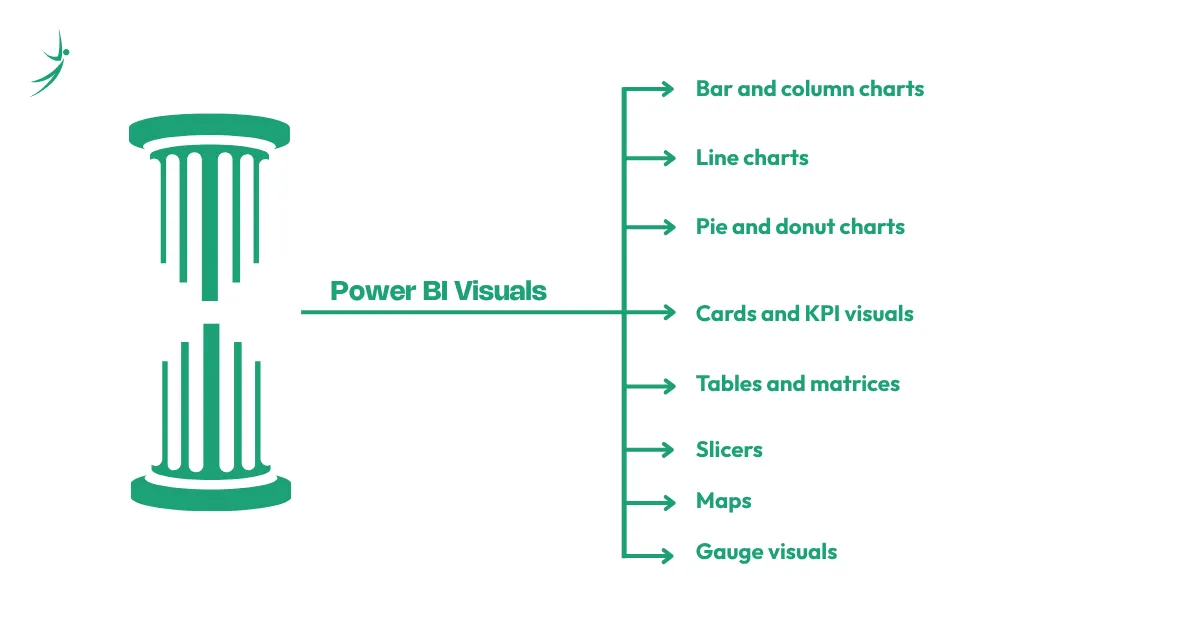
- Bar and column charts: Comparing values across categories
- Line charts: Tracking trends over time
- Pie and donut charts: Showing proportions of a whole
- Cards and KPI visuals: Highlighting a single key number, like total revenue or churn rate
- Tables and matrices: Displaying detailed, structured data
- Slicers: Interactive filters that let viewers narrow down what they see
- Maps: Visualizing geographic data
- Gauge visuals: Showing progress toward a target
Beyond the built-in options, Power BI supports custom visuals through Microsoft AppSource, a marketplace of additional chart types built and tested by Microsoft and third-party developers. Stick to AppSource for custom visuals; downloading visuals from unverified sources can introduce security risks.
A Quick Power BI Tutorial: Building Your First Report
This step-by-step Power BI tutorial walks through the core workflow every beginner needs to know.
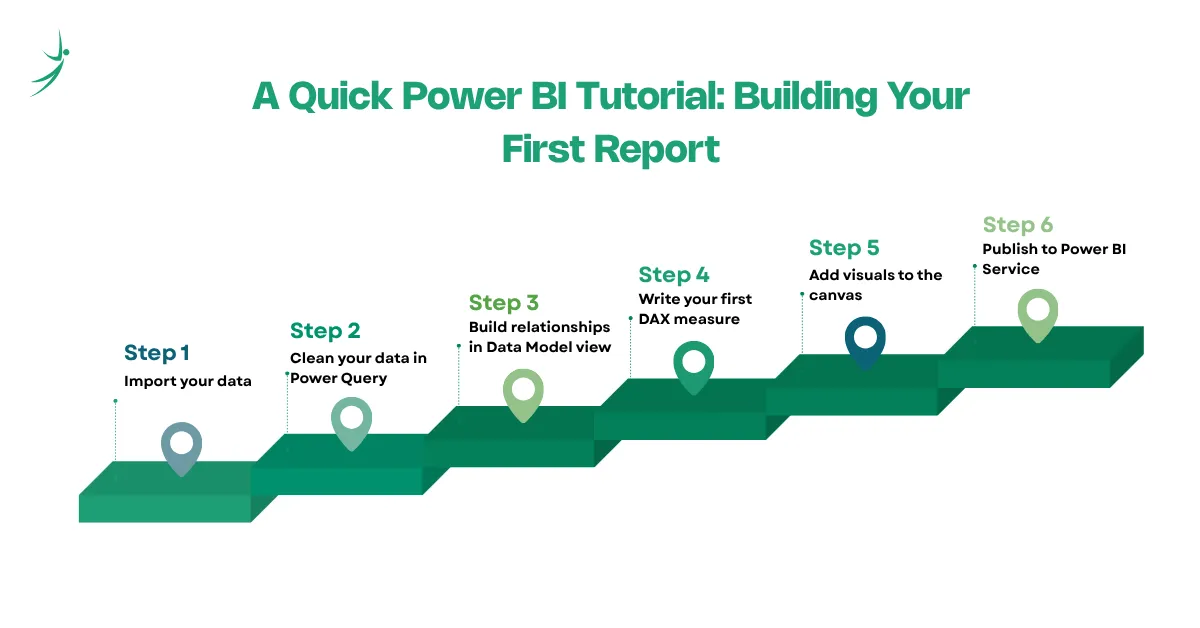
- Step 1: Import your data. Open Power BI Desktop, select "Get Data," and choose your source, Excel, CSV, a SQL database, or one of hundreds of supported connectors. For practice, Microsoft's free sample financial dataset is a good starting point.
- Step 2: Clean your data in Power Query. Selecting "Transform Data" opens Power Query Editor, where you remove blank rows, fix data types, merge tables, and handle inconsistencies before they reach your report.
- Step 3: Build relationships in Data Model view. If you've imported more than one table, Power BI lets you connect them through shared fields (for example, linking a Sales table to a Products table through a Product ID column).
- Step 4: Write your first DAX measure. DAX (Data Analysis Expressions) is the formula language behind every calculation in Power BI. A simple example: Profit Margin = SUM(Sales[Profit]) / SUM(Sales[Revenue])
- Step 5: Add visuals to the canvas. Drag fields from the Fields pane onto chart types in the Visualizations pane. Power BI auto-generates axis labels and titles based on the fields you use.
- Step 6: Publish to Power BI Service. Once your report is ready, sign in and click "Publish" to push it to the cloud, where you can pin visuals to dashboards and share access with your team.
Power BI vs Tableau: Which Should You Learn?
Power BI and Tableau comparisons come up constantly for beginners trying to decide where to invest their time. Here's a direct comparison:
| Factor | Power BI | Tableau |
|---|---|---|
| Free version | Yes (Power BI Desktop) | Yes (Tableau Public, but reports are public) |
| Platform | Windows only (Desktop); browser-based Service | Windows and macOS |
| Pricing | $14–$24/user/month | Generally higher, starts around $42/user/month for Explorer |
| Formula language | DAX | LOD (Level of Detail) expressions |
| Microsoft ecosystem integration | Native (Excel, Azure, SharePoint, SQL Server) | Limited |
| Learning curve | Beginner-friendly, especially for Excel users | Steeper, more design-flexible |
| Job demand globally | Very high, especially in finance, IT, and consulting | High, especially in marketing and design-heavy analytics roles |
For most beginners in Nepal, Power BI is the more practical first choice, largely because of its tight integration with Excel and the Microsoft ecosystem most local companies already use, and because Power BI Desktop is fully free for personal learning, unlike Tableau Public, which requires public sharing of your work. We'll cover Tableau in more depth in a dedicated beginner's guide as part of this series.
Data Analytics Meaning: Where Power BI Fits the Bigger Picture
To understand why Power BI matters, it helps to step back and understand data analytics meaning as a discipline. Data analytics is the process of collecting, cleaning, and examining data to answer specific business questions and guide decisions. Power BI is simply the tool that makes the final, most important step of that process, visualization and communication, fast and accessible.
Data analytics software broadly includes tools across the entire workflow: Excel and Google Sheets for basic manipulation, SQL for querying databases, Python and R for statistical analysis, and Power BI or Tableau for visualization and dashboarding. Power BI specifically sits at the intersection of data modeling and visualization, which is why it's taught as a core tool, not an optional extra, in almost every serious data analytics course.
Data Analytics Roadmap: Where Power BI Fits
If you're mapping out a full data analytics roadmap, Power BI typically comes after you've built a foundation in Excel and SQL, and before or alongside Python:
- Excel & Google Sheets: The foundation for structured data manipulation
- SQL: The standard language for pulling and aggregating data from databases
- Power BI: Turning analytical output into interactive dashboards stakeholders can actually use
- Python: Adding automation, advanced cleaning, and statistical depth
- Basic statistics: Mean, median, correlation, and hypothesis testing for interpreting patterns correctly
- Communication skills: Presenting findings clearly enough that decision-makers act on them
This is the exact sequence covered in our full data analytics vs data science comparison, if you want to understand how this roadmap branches depending on whether you're heading toward a data analyst or data scientist career.
As analytics tools become more AI-driven, understanding how Power BI fits into a broader AI-enabled workflow becomes increasingly important. This AI-powered analytics roadmap explains the progression from foundational analytics skills to modern AI-assisted business intelligence practices.
Data Analytics Business Use Cases: Why Companies Actually Need Power BI
Understanding data analytics business applications makes the "why" behind learning Power BI much clearer. Real businesses use Power BI dashboards for:
- Monitoring monthly sales targets against actuals in real time
- Tracking customer acquisition cost and lifetime value for marketing teams
- Visualizing loan default risk for banking and microfinance institutions
- Reporting program impact metrics for NGOs to donors and government partners
- Building HR dashboards tracking attrition, hiring pipeline, and headcount
This is precisely the kind of project-based work covered in our Business Data Analytics with AI course in Nepal, where students build real Power BI dashboards using business case studies rather than toy datasets.
Data Analytics Salary: Why Power BI Skills Pay Off
A fact-checked look at data analytics salary in Nepal shows a clear pattern: Power BI proficiency consistently separates entry-level data roles from mid-level ones.
- Entry-level data analysts in Nepal typically earn NPR 30,000–60,000 per month, often working primarily in Excel and basic SQL
- Mid-level data analysts (1–3 years) who've added Power BI and dashboard-building to their toolkit typically earn NPR 60,000–100,000 per month
- Senior data analysts (5+ years), especially those building enterprise dashboards and KPI systems, can earn NPR 100,000–150,000+ per month
This pattern holds globally as well: Power BI appears in the large majority of data analyst, business analyst, and BI analyst job postings on LinkedIn and Glassdoor, making it one of the highest-leverage tools a beginner can learn relative to the time it takes to pick up.
Data Analytics Remote Jobs: Power BI as a Global Ticket
One of the most practical reasons to learn Power BI in Nepal is data analytics remote jobs. Because Power BI is the dominant BI tool in the Microsoft-centric corporate world (finance, consulting, healthcare, and enterprise IT globally), Nepali analysts with strong Power BI portfolios are well-positioned to apply for remote data analyst roles with international companies, often paying significantly more than local market rates. A polished portfolio of three to five real Power BI dashboards, built around realistic business scenarios rather than tutorial-following, is one of the strongest assets a Nepali job-seeker can bring to remote job applications.
Power BI Course Free with Certificate vs Structured Training
Searching for a power bi course free with certificate will turn up several legitimate starting points:
- Microsoft Learn's official Power BI modules: Free, self-paced, and directly aligned with the PL-300 certification exam
- Power BI's own in-product tutorials: Built into Power BI Desktop under the "Learn" ribbon
- YouTube-based beginner tutorials: Useful for visual learners, though inconsistent in depth and not project-based
Free resources are genuinely useful for getting comfortable with the interface, but most learners hit a wall around DAX, data modeling, and building a portfolio strong enough for interviews. That's the gap a structured power bi course closes: real business datasets, mentor feedback, and a portfolio built specifically around what Nepali and international employers screen for.
Power BI Training in Nepal: What to Look For
If you're evaluating power bi training in Nepal, look for a program that covers more than just the software interface:
- Hands-on projects using real or realistic business datasets, not generic tutorial files
- DAX and data modeling taught in depth, not just drag-and-drop visuals
- Integration with SQL and Excel, since Power BI rarely works in isolation on the job
- A portfolio-building component, since most Nepali employers and remote recruiters now ask to see actual dashboards, not just a certificate
- AI-powered analytics exposure, since Power BI Copilot and AI-assisted reporting are increasingly part of real job requirements in 2026
Skill Shikshya's Business Data Analytics with AI course is built around exactly this structure: Power BI sits alongside Excel, SQL, and Python in a single, job-ready curriculum, with every module anchored in real business case studies rather than isolated software tutorials.
Power BI Guide: Quick Reference for Beginners
A quick power bi guide summary to keep handy as you start:
- Power BI Desktop is always free; only sharing through Power BI Service requires a paid license for most use cases
- DAX is the formula language; learning it well is the single biggest skill jump between beginner and intermediate users
- Always download Power BI Desktop from the Microsoft Store or the official Microsoft product page
- A report lives in Power BI Desktop and Service; a dashboard exists only in Power BI Service
- Power BI Service requires a Microsoft work or school account to log in and publish
Data Analytics Courses & Data Analytics Free Courses: Where Power BI Fits Your Learning Path
If you're comparing data analytics courses broadly, not just Power BI specifically, it helps to know where free options end and where structured training adds real value.
Data analytics free courses worth starting with include Microsoft Learn's Power BI fundamentals path and Google's free introductory data analytics materials. These build vocabulary and basic comfort with the tools.
Where free courses consistently fall short is in project depth, the kind of multi-step, messy, realistic business projects that actually get referenced in job interviews, and in structured feedback on your work. That's the gap our Business Data Analytics with AI course in Nepal is built to close: a 2.5-month, project-based program covering Excel, SQL, Power BI, Python, and AI-powered analytics tools, with real business case studies and portfolio development built in from day one.
Frequently Asked Questions
What is Power BI used for?
Is Power BI free to download?
What is the difference between Power BI Desktop and Power BI Service?
Is Power BI better than Excel?
Is Power BI better than Tableau?
How long does it take to learn Power BI as a beginner?
Do I need to know SQL to learn Power BI?
About Author: