How to Get Started in Business Data Analytics: Beginner's Guide | Skill Shikshya
career-guides •10 Jun 2026•21 min Read
Business data analytics is one of the most in-demand and fastest-growing disciplines in today's business world. Whether you are a student exploring tech career options, a business professional ready to move from spreadsheets to data-driven decision-making through a hands-on data analytics training programme, or an IT professional looking to add a high-value skill to your portfolio, understanding data analytics gives you a genuinely future-proof advantage.
This guide is your starting point. You will learn what data analytics is at its core, why companies across Nepal and globally rely on it at scale, and how it translates into real career success from entry-level data analytics intern roles in Kathmandu to remote positions with international clients.
Basics of Data Analytics
At its simplest, data analytics meaning comes down to this: it is the process of examining raw data to find patterns, draw conclusions, and support better decisions. Every business collects data. Data analytics is what turns that data into something useful.
Before structured data analytics practices, companies made decisions based on gut feeling, outdated reports, and fragmented spreadsheets. Data analytics changes that entirely. Analysts work across departments marketing, finance, operations, product giving leadership the clarity they need to act confidently.
Business data analytics goes deeper than running reports, though. It is a discipline that combines statistical thinking, technical tooling, and domain knowledge to answer the questions that actually matter: which products are selling, which customers are churning, which processes are costing the company money, and what to do about all of it.
What Makes Data Analytics Different?
Most IT and business roles focus on doing things. Data analytics focuses on understanding things what happened, why it happened, what is likely to happen next, and what action produces the best outcome.
Core Pillars of Data Analytics
Think about how decisions get made in a typical company. A manager asks why sales dropped last quarter. Someone pulls a report from an old system. Another person runs a different query and gets a different number. Nobody agrees on what the data actually says. Data analytics replaces that chaos with a structured data analytics process that turns raw information into clear, trusted insight.
That shift in how businesses operate is what makes data analytics one of the most valuable disciplines in modern work whether you are joining a tech startup in Kathmandu or supporting a multinational client from a remote setup in Nepal.
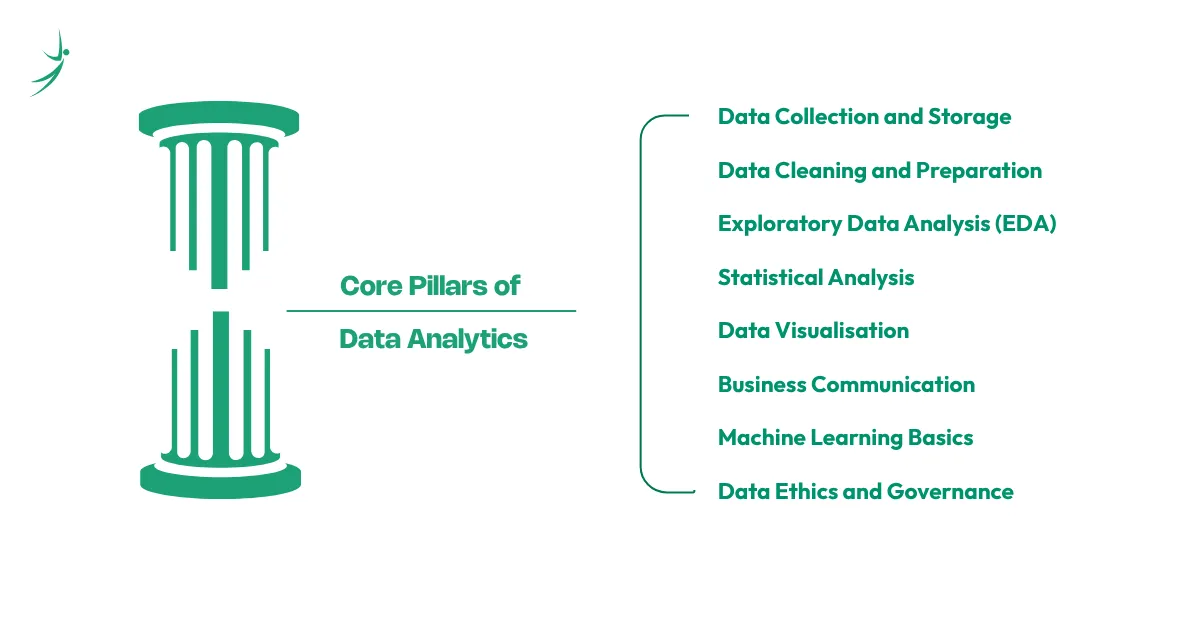
Here are the core pillars every aspiring data analytics specialist needs to understand:
- Data Collection and Storage: Gathering data from databases, APIs, spreadsheets, and business systems using SQL, Python, and data warehouses like BigQuery or Snowflake.
- Data Cleaning and Preparation: Transforming raw, messy data into a reliable format ready for analysis often the most time-consuming step of any real-world data analytics project.
- Exploratory Data Analysis (EDA): Using statistical techniques and visualisation to understand distributions, spot outliers, and identify patterns before drawing any conclusions.
- Statistical Analysis: Applying probability, hypothesis testing, and regression methods to understand relationships in data and quantify uncertainty around findings.
- Data Visualisation: Communicating findings through clear charts, dashboards, and reports using data analytics software tools like Power BI, Tableau, and Google Looker.
- Business Communication: Translating technical findings into plain language that non-technical stakeholders can act on this is what separates good analysts from great ones.
- Machine Learning Basics: Understanding how predictive models work, when to use them, and how to interpret their outputs, even if you are not building them from scratch.
- Data Ethics and Governance: Handling data responsibly, understanding privacy regulations, and ensuring analyses are fair and unbiased.
Each of these pillars connects to the others. You cannot build a reliable analysis without clean data. You cannot communicate findings without visualisation. Data analytics is a system, not a checklist.
Why Data Analytics Matters Today
The ability to turn data into decisions is now a competitive advantage. Companies that act on real insight move faster, waste less, and serve customers better than those relying on guesswork. Data analytics is how organisations at every size close that gap.
The global data analytics market was valued at over $49 billion in 2025 and is projected to grow at a CAGR of over 27% through 2030, according to multiple industry research reports including Grand View Research and Mordor Intelligence. Every industry banking, healthcare, retail, logistics, and government is either building data analytics capability or actively looking for professionals who can deliver it.
In Nepal, the picture is equally strong. Banks, telecom companies, e-commerce platforms, and IT outsourcing firms in Kathmandu are building internal analytics teams. Data analytics training in Nepal has seen growing demand as organisations realise that spreadsheets and monthly PDF reports cannot keep up with what modern business requires. Add to that the remote work opportunity data analytics remote jobs for international clients are fully accessible from Nepal and the career case becomes very hard to ignore.
Key Insight: You do not need a mathematics or computer science degree to get started in data analytics. A structured learning roadmap, the right hands-on data analytics projects, and one or two recognised certifications can take you further than a four-year degree alone if you approach your learning the right way.
Where Do You Begin? A 6-Step Starting Point
Before going deep into career outcomes, here is the honest starting sequence for anyone completely new to data analytics for beginners:
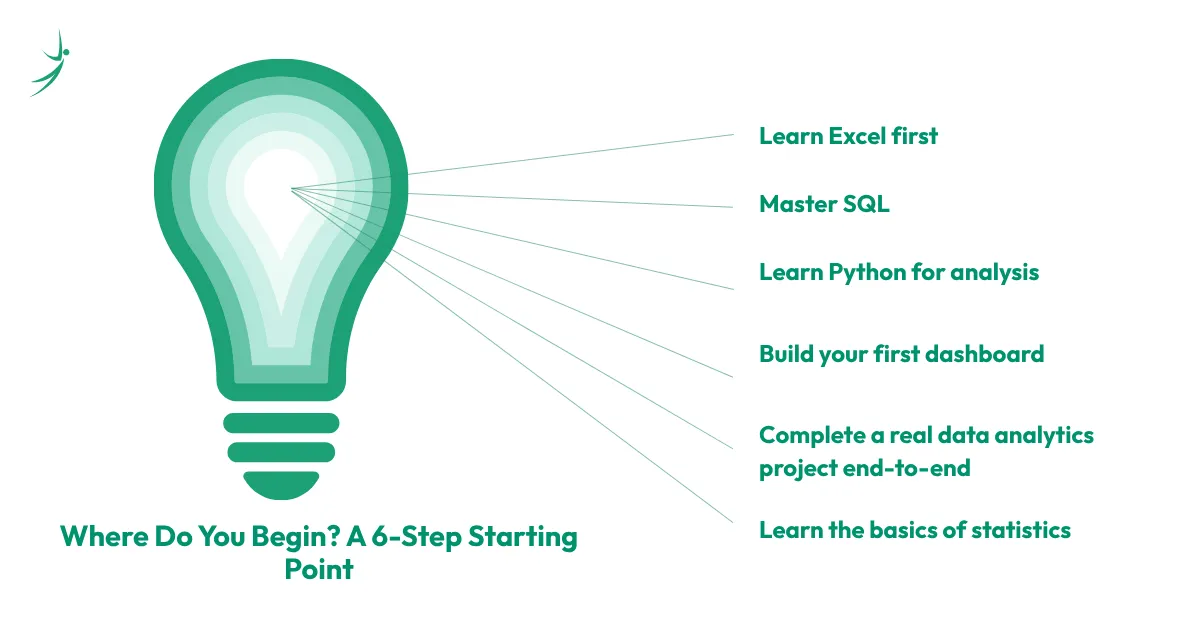
- Learn Excel first: Microsoft Excel is still used in every organisation that works with data. Spend two to three weeks getting comfortable with pivot tables, VLOOKUP/XLOOKUP, conditional formatting, and basic charting before anything else. It is the universal entry point for any data analytics beginner.
- Master SQL: SQL is the language of data. Every database, every data warehouse, and most analytics platforms use it. Learning to query, filter, join, and aggregate data with SQL is the single most important technical skill a data analyst can have.
- Learn Python for analysis: Python is the most in-demand language for data analytics globally. Start with pandas for data manipulation and matplotlib or seaborn for visualisation. Free resources on platforms like Kaggle, Coursera, and Google's own data analytics courses make this more accessible than ever.
- Build your first dashboard: Use Power BI or Tableau both offer free versions and create a dashboard from a real dataset. Kaggle has hundreds of free datasets. This single project teaches you more about data storytelling than weeks of reading.
- Complete a real data analytics project end-to-end: Find a public dataset relevant to Nepal traffic data, agricultural data, economic indicators and complete a full analysis cycle: collect, clean, explore, visualise, and present your findings. Document everything on GitHub.
- Learn the basics of statistics: Understand mean, median, variance, correlation, and hypothesis testing. You do not need to go deep into academic statistics, but you need enough to know when a pattern in your data is real and when it is noise.
Most learners who follow this sequence consistently are ready to apply for entry-level data analytics jobs within five to eight months.
How Getting Started in Data Analytics Drives Real Career Success
Understanding the pillars is the foundation. The real reason to pursue data analytics is what it delivers stability, strong earnings, and long-term career growth that compounds year after year.
One of the Most Stable Job Markets in Tech and Business
Data analytics roles are among the least affected by economic slowdowns because they are tied directly to how businesses operate and make decisions. Every company that collects customer data, tracks sales, or manages operations needs someone who can make sense of it. That need does not go away in a downturn if anything, it intensifies when resources are tight and every decision carries more weight.
Data analytics intern opportunities in Nepal are becoming more common as local companies begin investing seriously in their data infrastructure. For fresh graduates, getting analytics exposure early puts you ahead of most peers entering the job market especially in banking, fintech, and the growing e-commerce sector.
Some of the Strongest Salaries in Business and IT
Data Analytics Salary Progression
Data analytics commands strong compensation at every career level. According to Kumari Job's 2026 salary guide and Glassdoor's data analyst salary data, here is what the market looks like today:
| Experience Level | Nepal (NPR/month) | India (INR/year) | USA (USD/year) |
|---|---|---|---|
| Entry-Level (0–1 years) | NPR 25,000 – 55,000 | ₹4 – 7 LPA | $65,000 – $85,000 |
| Mid-Level (2–4 years) | NPR 70,000 – 1,30,000 | ₹9 – 16 LPA | $90,000 – $120,000 |
| Senior-Level (5+ years) | NPR 1,30,000 – 3,00,000+ | ₹18 – 28 LPA | $130,000 – $170,000+ |
Note that data analytics remote jobs for international clients in Nepal typically pay significantly more than the local market range, particularly for analysts with Python, SQL, Power BI, or machine learning expertise.
A Direct Path to Remote and Global Work
Data analytics is one of the most remote-compatible disciplines across all of business and IT. Dashboard building, SQL analysis, reporting, Python modelling, and stakeholder presentations can all be handled from anywhere with a reliable internet connection.
For professionals in Nepal, this creates a genuine path to international-level work and compensation without relocating. Business analytics in Nepal increasingly connects to remote positions with companies in Europe, the US, Australia, and Southeast Asia and the skill set that earns you those roles is the exact same one you build locally.
Compounding Technical Knowledge
Each data analytics concept you learn makes the next one easier. Excel makes SQL easier. SQL makes Python easier. Python makes statistical analysis easier. Statistical analysis makes machine learning easier. The early learning curve is steep but it flattens fast, and the analysts who push through that initial phase build knowledge that compounds for their entire career.
Senior data analytics specialists and analytics managers do not just earn more they become the people organisations rely on to shape strategy. That kind of positioning is hard to reach in many other disciplines, but data analytics creates a clear, logical path to get there.
You Are at the Centre of Every Business Decision
Most roles sit on one side of the business either building the product or selling it. Data analytics professionals sit in the middle, informing every function. They work with marketing teams, finance departments, product managers, operations leads, and C-suite executives. That cross-functional visibility makes skilled analysts some of the hardest people to replace in any organisation.
When the marketing team wants to know which campaign actually drove revenue, the analyst answers. When leadership asks why customer churn spiked last month, the analyst builds the model that explains it. That kind of ownership builds reputation and career momentum fast.
Real-World Impact: Professionals who complete structured data analytics courses and earn recognised certifications Microsoft Power BI Data Analyst Associate, Google Data Analytics Professional Certificate, or IBM Data Analyst Professional Certificate consistently land roles faster and negotiate higher starting salaries than self-taught peers. Credentials signal to employers that your skills have been validated, not just listed on a resume.
The Core Data Analytics Tools You Need to Know
Data analytics software tools fall into a few clear categories. You do not need to master all of them from day one, but knowing what each one does and where it fits in the data analytics process gives you a map for your learning journey:
- Spreadsheets: Microsoft Excel and Google Sheets the universal starting point for data analytics for beginners in any industry.
- Query Languages: SQL non-negotiable for anyone working with databases or data warehouses. Every analyst uses it daily.
- Programming Languages: Python (pandas, NumPy, matplotlib, seaborn) the most in-demand technical skill in data analytics globally. R is equally valid for statistical work.
- Business Intelligence Platforms: Power BI, Tableau, Google Looker, and Metabase for building the dashboards and reports stakeholders actually use to make decisions.
- Database and Warehouse Platforms: PostgreSQL, MySQL, Google BigQuery, Snowflake, and Amazon Redshift where enterprise data lives and where analysts spend significant time querying.
- Statistical and ML Libraries: Scikit-learn, Statsmodels, and SciPy for analysts moving into predictive and prescriptive data analytics.
- Collaboration and Documentation: Git and GitHub for version-controlling analysis scripts; Jupyter Notebooks for documenting and sharing the full data analytics process.
The right combination depends on the role. A data analyst at a Nepali bank will use SQL and Power BI daily. A data science analyst at a product company might spend most of their time in Python. Understanding the full landscape of data analytics tools helps you choose the path that matches where you want to go.
Data Analytics Roadmap: What to Learn and When
A structured data analytics roadmap keeps you from jumping between topics without building real depth. Here is a practical phase-by-phase sequence for anyone starting from zero:
- Phase 1 Foundations (Months 1–2): Excel, Google Sheets, basic statistics, and an introduction to data types and database concepts. Build comfort working with data before touching any code. Many data analytics free courses on Coursera, edX, and Google Career Certificates cover this phase at no cost.
- Phase 2 SQL and Databases (Months 2–3): Learn SQL from SELECT basics through JOINs, subqueries, window functions, and aggregate analysis. Complete at least five real dataset projects using a free tool like DB Fiddle or a local PostgreSQL install.
- Phase 3 Python for Data Analysis (Months 3–5): Learn Python fundamentals, then dive into pandas, NumPy, and matplotlib. Automate a data cleaning task, build a visualisation from a real dataset, and publish your work on GitHub.
- Phase 4 Data Visualisation and BI Tools (Months 4–6): Build interactive dashboards in Power BI or Tableau. Connect to real data sources, design reports for a non-technical audience, and get comfortable with calculated fields, filters, and drill-down navigation.
- Phase 5 Statistics and Analytics Thinking (Months 5–7): Understand distributions, hypothesis testing, A/B testing, regression, and correlation. Apply these concepts to real business questions rather than textbook exercises.
- Phase 6 Portfolio and Job Readiness (Months 6–8): Complete two to three end-to-end data analytics projects documented on GitHub. Prepare for common interview scenarios involving case studies and SQL challenges. Begin applying for data analytics intern and junior analyst roles in Kathmandu and remotely.
Data Analytics Career Paths
One of the strongest aspects of data analytics as a discipline is how many different directions it can take your career. The data analytics roadmap you follow as a beginner opens up into multiple specialist tracks:
- Business Analyst: Works with stakeholders across departments to define data requirements, build reports, and translate findings into business recommendations. Heavy Excel, SQL, and BI tool usage. A natural entry point for professionals coming from non-technical business backgrounds.
- Data Analyst: The core role in data analytics business environments. Owns the full process from pulling and cleaning data to building dashboards and presenting insights. SQL and Python are essential; Power BI or Tableau for visualisation.
- Marketing Analyst: Focused on campaign performance, customer segmentation, attribution modelling, and channel ROI. High demand in Nepal's growing e-commerce and digital marketing sector.
- Financial Analyst: Works with revenue, cost, and forecast data. Strong Excel and SQL skills are critical; Python is increasingly valued for financial modelling automation.
- Data Science Analyst: The bridge between data analytics and machine learning. Builds predictive models, runs statistical experiments, and works with engineering teams to deploy analytical outputs into products.
- Analytics Manager / Lead: Oversees a team of analysts, defines data strategy, and ensures the organisation's data infrastructure supports business objectives. The natural senior progression for experienced data analytics specialists.
Each path is accessible from the same foundation. The skills you build as a data analytics beginner SQL, Python, visualisation, statistical thinking are the same ones that underpin every specialisation above.
What's Next? Go Deeper into Data Analytics
Now that you have a clear picture of what data analytics is and why it matters, the next step is building the actual skills. The following guides in this series take you through everything you need to go from complete beginner to job-ready analyst:
- A month-by-month data analytics roadmap what to learn, in what order, and how long each phase realistically takes
- The core data analytics tools every analyst uses daily and how to get hands-on practice with each one
- Every major data analytics career path from junior analyst to data scientist to analytics manager
- The top data analytics courses and certifications to pursue in 2026, with an honest breakdown of which ones are worth your time and which data analytics free courses deliver real value
- How to build a data analytics portfolio with no prior job experience
- Where data analytics is heading in 2026 and beyond AI-augmented analytics, real-time data platforms, and the rise of the analytics engineer
Learn Data Analytics with Skill Shikshya
Reading about the data analytics roadmap is a great start. Applying it is what builds real skills and real careers.
At Skill Shikshya, our Business Data Analytics with AI Course in Nepal takes you from complete beginner to job-ready professional through hands-on, project-based training. Whether you prefer structured classroom sessions in Kathmandu or online learning on your own schedule, the programme is built around what businesses in Nepal and internationally actually hire for.
- Practical, project-based learning: Build real dashboards, run full analysis cycles, and work with live datasets. Every module ends with something you can show an employer.
- Expert instructors: Learn from professionals with hands-on industry experience in data analytics, business intelligence, and Python-based analysis not just theory.
- Career support: Get guidance on certifications, portfolio building, and landing your first data analytics job in Nepal or as a remote analyst for international clients.
- Flexible schedule: Designed to fit students, working professionals, and career switchers equally. Choose between in-person sessions at our Kathmandu data analytics institute or online learning at your own pace.
- Free introductory content: Access data analytics free courses and sample modules before committing to the full programme.
Start your data analytics journey with hands-on training, real projects, and expert mentorship at Skill Shikshya.
Frequently Asked Questions
What is data analytics in simple terms?
Data analytics is the process of examining raw data to find useful patterns, draw conclusions, and help people make better decisions. Think of it this way: every business generates data sales numbers, website visits, customer complaints, delivery times. Data analytics is the discipline that turns that raw pile of numbers into clear answers. Instead of guessing why sales dropped last month, a data analyst pulls the actual data, cleans it, analyses it, and tells you exactly what happened and why. In simple terms, data analytics means using data to replace guesswork with facts.
How do I start learning data analytics as a complete beginner?
Start with Excel it is free, universally used, and teaches you how data is structured before you touch any code. Spend two to three weeks getting comfortable with pivot tables, basic formulas, and sorting. Then move to SQL, which is the language used to pull data from any database. After that, learn Python using free resources on Kaggle or Google's Data Analytics course on Coursera. Build one real project even a simple analysis of a public dataset and document it on GitHub. That project matters more to employers than any certificate alone. Most complete beginners who follow this sequence consistently are ready for entry-level data analytics jobs within five to eight months.
Is data analytics a good career in Nepal?
Yes data analytics is one of the strongest career choices available in Nepal's IT sector right now. Banks, telecom companies, fintech startups, e-commerce platforms, and IT outsourcing firms in Kathmandu are actively hiring data analysts. Entry-level salaries range from NPR 30,000 to 55,000 per month, and mid-level professionals with two to four years of experience earn between NPR 70,000 and 1,30,000 per month. Beyond local roles, data analytics is one of the most remote-compatible disciplines in tech analysts with SQL, Python, and Power BI skills regularly work with international clients from Nepal, often at significantly higher pay than the local market. The demand is growing, the skill gap is real, and the career path is clear.
Do I need a programming background to learn data analytics?
No you do not need any prior programming experience to start learning data analytics. The field is designed to be accessible from a non-technical starting point. Excel and SQL are the foundation of data analytics, and neither requires coding knowledge. Python comes later in the learning journey and is introduced gradually through hands-on data tasks rather than abstract programming theory. Many successful data analysts in Nepal and globally came from business, economics, finance, and even arts backgrounds. What matters more than a programming background is logical thinking, attention to detail, and the willingness to learn tools step by step.
Which tool should I learn first Excel, SQL, or Python?
Learn them in exactly that order: Excel first, then SQL, then Python. Excel teaches you how data is structured and how to think about rows, columns, filters, and aggregations all of which make SQL much easier when you get there. SQL then teaches you how to query real databases, which is a daily task for almost every data analyst on the planet. Python builds on both and adds automation, advanced analysis, and visualisation power. Skipping Excel to go straight to Python is a common mistake beginners make it makes the learning curve steeper than it needs to be and leaves gaps in your fundamentals that show up in job interviews.
How long does it take to become a data analyst?
Most learners with no prior background can reach entry-level job readiness in five to eight months with consistent study of around one to two hours per day. A structured programme like Skill Shikshya's Business Data Analytics with AI course can get you there faster with guided projects and mentorship. The honest timeline depends on three things: how consistent you are, whether you are doing hands-on projects or just watching tutorials, and whether you pursue a certification that validates your skills to employers. Reading and watching alone will not get you hired. Building real projects and a documented portfolio is what accelerates the transition from learner to job-ready analyst.
How much does a data analyst earn in Nepal?
According to Kumari Job's salary data and multiple Nepal salary surveys, data analytics salary ranges in Nepal by experience level are as follows. Entry-level analysts with zero to one year of experience earn between NPR 30,000 and 55,000 per month. Mid-level analysts with two to four years of experience earn between NPR 70,000 and 1,30,000 per month. Senior analysts and analytics leads with five or more years of experience earn NPR 1,30,000 to 3,00,000 or more per month. Analysts working remotely for international clients in Europe, the US, or Australia typically earn significantly more than local market rates, especially those with specialised skills in Python, Power BI, or machine learning.
What certifications should I get first?
For complete beginners, the Google Data Analytics Professional Certificate on Coursera is the best starting point. It is beginner-friendly, covers Excel, SQL, R, and Tableau, takes three to six months to complete, and carries strong recognition among hiring managers. Once you have the Google certificate, pair it with one tool-specific credential: the Microsoft Power BI Data Analyst Associate (PL-300) if you want to specialise in business intelligence dashboards, or the IBM Data Analyst Professional Certificate if you want deeper Python and SQL training. That combination one comprehensive certificate plus one tool-specific credential is the strongest entry-level certification stack for data analytics jobs in Nepal and for remote roles in 2026.
Are there data analytics free courses available online?
Yes several high-quality data analytics free courses are available from globally recognised providers. Google offers free learning paths covering Excel, SQL, and data foundations through Google Skillshop. Kaggle provides completely free, hands-on courses in Python, SQL, data visualisation, and machine learning that include real datasets and certificates. Microsoft Learn offers free Power BI training modules that directly prepare you for the PL-300 exam. The IBM Data Analyst Professional Certificate on Coursera is paid but offers financial aid to learners who cannot afford the subscription. For Nepal-based learners, Skill Shikshya also offers free introductory content before the full programme. Free courses are a genuine starting point the key is to pair them with real projects rather than collecting certificates without applying the skills.
What is the difference between data analytics and data science?
Data analytics and data science are related but serve different purposes. Data analytics focuses on examining existing, structured data to answer specific business questions what happened, why it happened, and what the business should do about it. The primary tools are SQL, Excel, Python for analysis, and dashboards in Power BI or Tableau. Data science goes further it builds predictive models, machine learning algorithms, and automated systems that forecast future outcomes and process large volumes of unstructured data like text, images, and audio. Think of it this way: a data analyst tells you why customer churn increased last quarter using historical data; a data scientist builds a model that predicts which customers are likely to churn next month before it happens. Data analytics is the better entry point for beginners it is more accessible, does not require advanced mathematics, and leads directly to in-demand roles. Many professionals start in analytics and move into data science after building their technical foundation.