What is Data Analytics? A Complete Guide for Beginners | Skill Shikshya
If you have spent any time in business or tech circles lately, you have probably heard people talk about "data-driven decisions," "dashboards," and "analytics." But what do those terms actually mean in practice?
Whether you are a student exploring career options, a business professional trying to understand why your company keeps talking about data, or someone actively searching for data analytics courses in Nepal, understanding what data analytics is and what it actually does is one of the most valuable things you can learn right now. If you are wondering where to begin, our guide on how to get started in data analytics outlines the skills, learning path, and career opportunities available for aspiring analysts.
This guide breaks down everything you need to know about data analytics: its definition, the four core types, how the process works, the tools professionals use daily, and what career opportunities look like right here in Nepal.
If you are serious about building a career with data, structured guidance accelerates your learning curve significantly. Explore our Business Data Analytics with AI Course to gain hands-on experience with real datasets, Power BI, Python, and SQL while building real-world projects and receiving mentorship from industry professionals.
What is Data Analytics?
At its core, what is data analytics? It is the process of examining raw data numbers, records, transactions, user behaviour to uncover patterns, extract insights, and support better decisions. Instead of managers relying on gut feeling or outdated reports, data analytics gives organisations a clear, evidence-based picture of what is actually happening in their business.
What Does Data Analytics Actually Mean?
To fully understand the data analytics meaning, you have to look beyond the definition. Data analytics is not just about running reports. It is a discipline that combines statistical thinking, technical tools, and domain knowledge to answer the questions that actually drive business outcomes: which products are selling, which customers are leaving, which processes are costing the company money, and what to do about all of it.
When someone talks about business data analytics, they are referring to this exact discipline applied in a commercial context using data to improve performance, reduce costs, increase revenue, and make decisions that are backed by evidence rather than opinion.
Is Data Analytics the Same as Data Science?
One of the most common questions beginners ask is: is data analytics the same as data science?
The answer is no but they are closely related. Data analytics focuses on examining existing, structured data to answer specific business questions and communicate findings. Data science goes further, building predictive models and machine learning algorithms that forecast future outcomes and process large volumes of unstructured data. Think of it this way: a data analyst tells you why customer churn increased last quarter; a data scientist builds a model that predicts which customers will leave next month before it happens. Data analytics is the better entry point for beginners. It is more accessible, does not require advanced mathematics, and leads directly to in-demand roles.
The Four Core Types of Data Analytics
The beauty of data analytics is how cleanly it answers different kinds of business questions depending on which type you apply. Let us look at how each type works and what it is actually used for.
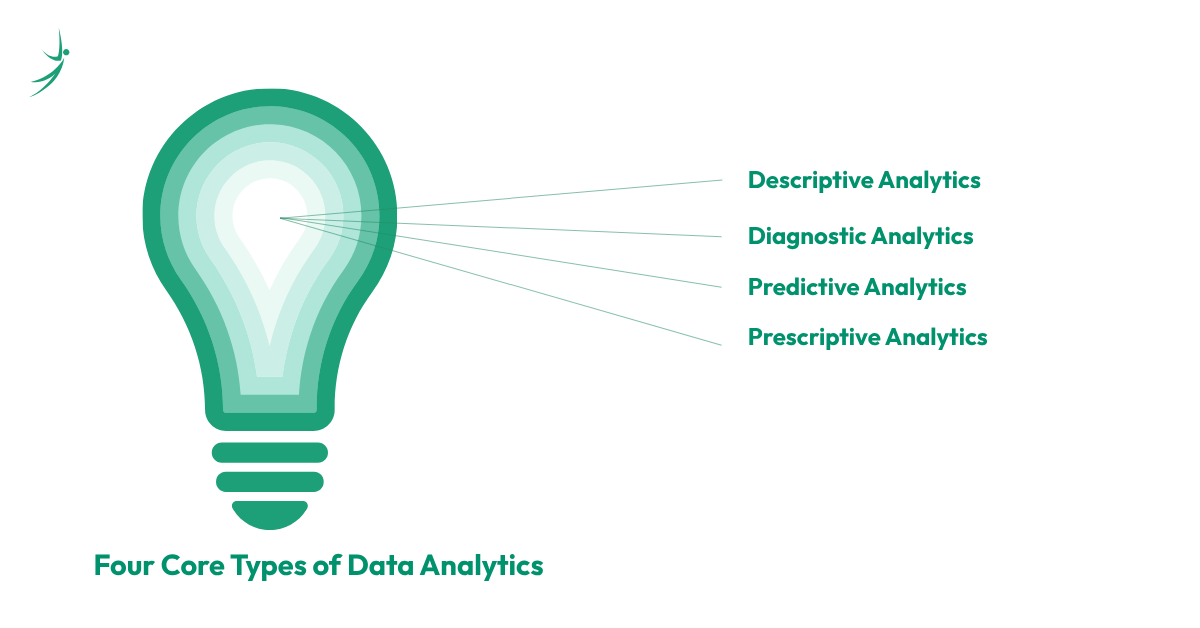
1. Descriptive Analytics (What Happened?)
Descriptive analytics is the foundation of all data analysis. It focuses on summarising historical data to understand past performance what sold last month, how many users visited the website, where revenue came from last quarter. Every dashboard you have ever seen that shows sales figures, website traffic, or customer counts is descriptive analytics in action.
This is the type most analysts spend the majority of their time on. It requires strong skills in SQL for pulling data, Excel or Python for organising it, and Power BI or Tableau for presenting it clearly to stakeholders.
2. Diagnostic Analytics (Why Did It Happen?)
Diagnostic analytics goes one level deeper. Instead of just reporting what happened, it investigates why it happened. If sales dropped last month, diagnostic analytics is what finds the root cause was it a specific product category, a geographic region, a pricing change, or a competitor move?
This type involves drilling into data, comparing segments, and identifying correlations. SQL, Python, and statistical analysis are the primary tools used here. Skilled diagnostic analysts are among the most valuable people in any organisation because they turn confusing data into actionable explanations.
3. Predictive Analytics (What Will Happen?)
Predictive analytics uses historical data, statistical models, and machine learning techniques to forecast future outcomes. Which customers are most likely to buy again? Which products will run out of stock next week? Which employees are at risk of leaving?
This is where data analytics starts to overlap with data science. Predictive analytics requires a solid foundation in statistics and an understanding of how machine learning models work even if you are not building them from scratch. It is a natural progression for analysts who have mastered the first two types.
4. Prescriptive Analytics (What Should We Do?)
Prescriptive analytics is the most advanced type. It does not just predict what will happen it recommends the best course of action to take. Recommendation engines (like what Netflix suggests you watch or what Amazon recommends you buy) are prescriptive analytics systems. Dynamic pricing, automated inventory management, and personalised marketing campaigns are all powered by prescriptive models.
For most professionals in Nepal starting their data analytics journey, descriptive and diagnostic analytics are where the real job market sits. Predictive and prescriptive are the career growth trajectory.
Core Components of Data Analytics (The 5 Layers)
Just as the MERN stack has four technologies working in harmony, data analytics has five interconnected layers that must all function cleanly for analysis to produce reliable results. Let us look at how data flows through these components to turn raw information into a business decision.
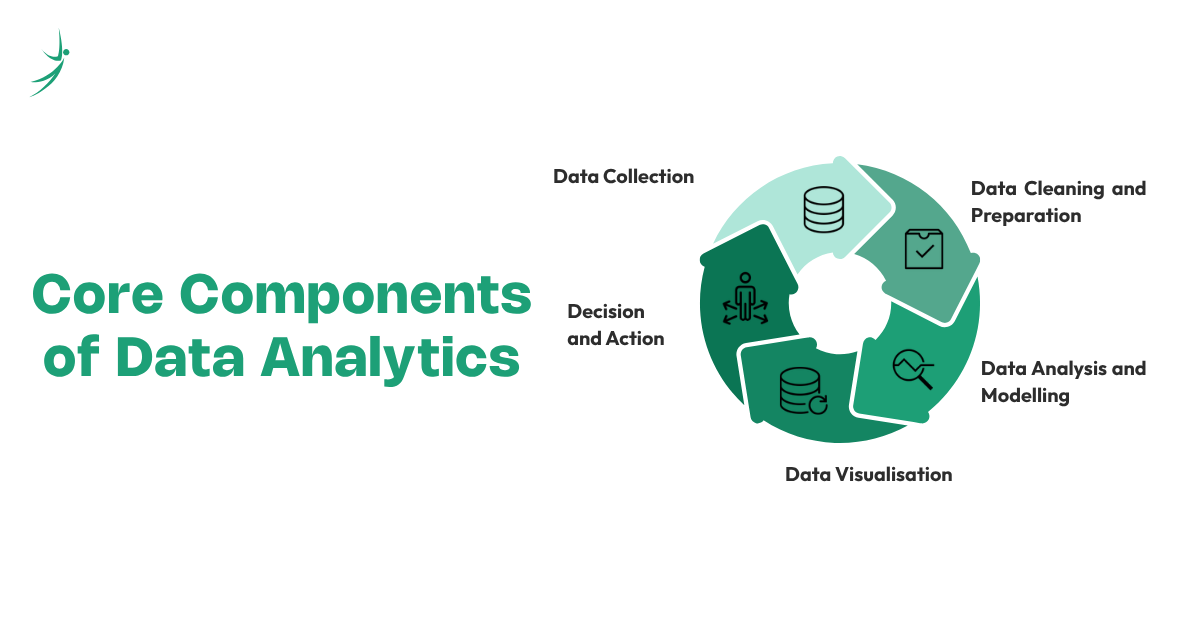
1. Data Collection (The Source Layer)
Every data analytics process starts with collecting the right data. This means pulling information from databases, business systems, APIs, spreadsheets, web analytics platforms, CRM tools, and external sources. The quality and completeness of data at this stage determines everything that follows.
Data analysts work with tools like SQL to query databases, Python to connect to APIs, and Excel or Google Sheets for manual data sources. In Nepal's growing tech sector, common data sources include banking transaction systems, e-commerce platforms, ERP software, and digital marketing platforms.
2. Data Cleaning and Preparation (The Foundation Layer)
Raw data is almost always messy. It contains duplicates, missing values, inconsistent formats, and errors introduced during collection. Data cleaning also called data wrangling or data preparation is the process of transforming raw data into a reliable, analysis-ready format.
This is the layer that surprises most beginners: experienced analysts estimate that 60 to 80 percent of real-world analytics work involves cleaning and preparing data, not performing the analysis itself. Python's pandas library and SQL are the primary tools at this stage. Skipping this layer or rushing through it produces misleading results no matter how sophisticated your analysis is.
3. Data Analysis and Modelling (The Engine Layer)
With clean data in hand, this is where the actual analytical work happens. Analysts apply statistical techniques, write queries, run calculations, and build models to find patterns, test hypotheses, and answer specific business questions.
This layer uses SQL for querying, Python or R for statistical analysis, and machine learning libraries like Scikit-learn for predictive modelling. The depth of analysis performed here depends on which of the four types of analytics the project calls for descriptive work stays close to aggregations and summaries, while predictive work introduces regression models and classification algorithms.
4. Data Visualisation (The Communication Layer)
Insight with no communication is worthless. Data visualisation translates analytical findings into charts, dashboards, and reports that non-technical stakeholders managers, executives, clients can understand and act on.
This is where data analytics software tools like Power BI, Tableau, and Google Looker become critical. A well-designed dashboard does not just display numbers it tells a story that leads a decision-maker to the right conclusion. For data analytics professionals in Nepal, Power BI is the most in-demand visualisation tool in the local job market right now.
5. Decision and Action (The Output Layer)
The final layer is where data analytics delivers its actual value: a business decision gets made and acted upon. A marketing team adjusts its budget. A product team prioritises a feature fix. An operations manager changes a process. Without this layer, all the preceding work is just academic exercise.
This layer requires communication skills as much as technical skills. Data analysts who can present findings clearly, answer stakeholder questions confidently, and translate numbers into plain business language are consistently the most valued professionals in any analytics team.
The Data Analytics Process: How It Works End-to-End
Understanding the data analytics process as a sequential workflow not a set of isolated tasks is what separates analysts who produce reliable insights from those who produce pretty charts that nobody trusts.
Here is how a complete data analytics project flows:
- Stage 1 Define the Business Question: Before touching any data, a good analyst starts by understanding exactly what decision the analysis needs to support. Vague questions produce vague answers. "Why did revenue drop in Q1?" is a better starting point than "analyse our sales data."
- Stage 2 Identify and Collect Data: Locate the data sources relevant to the question, check their reliability, and extract the data using SQL queries, API calls, or file imports. Document where every piece of data came from.
- Stage 3 Clean and Prepare the Data: Remove duplicates, handle missing values, standardise formats, and validate that the data actually represents what it claims to represent. This step is non-negotiable no amount of sophisticated analysis fixes dirty data.
- Stage 4 Explore and Analyse: Run exploratory data analysis to understand distributions, spot outliers, and identify initial patterns. Then apply the appropriate analytical technique aggregation, comparison, statistical testing, or modelling to answer the original business question.
- Stage 5 Visualise and Communicate: Build the dashboard, chart, or report that presents the finding in a format the decision-maker can immediately understand. Design for clarity, not complexity.
- Stage 6 Deliver Insight and Recommend Action: Present findings, answer questions, and recommend the action the data supports. Follow up to measure whether the decision made based on your analysis produced the expected outcome.
This six-stage cycle is what every data analytics project from a simple sales report to a complex machine learning model moves through. Learning this process is more important than learning any individual tool.
The Data Analytics Tools Ecosystem
While the process above describes what analysts do, the data analytics tools they use are what make it possible at scale. Just like a construction project needs different tools for different stages, data analytics software tools fall into clear categories based on where they sit in the process.
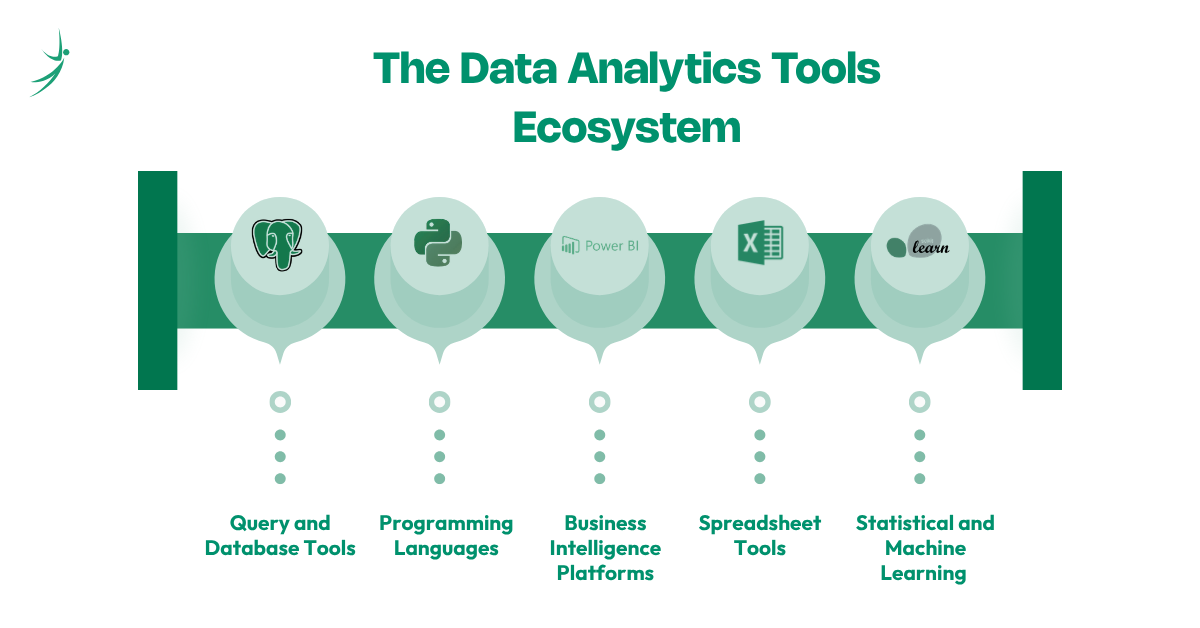
1. Query and Database Tools: SQL Platforms
SQL is the universal language of data analytics. Every database from a local PostgreSQL install to enterprise cloud warehouses like Google BigQuery, Snowflake, and Amazon Redshift uses SQL for querying, filtering, joining, and aggregating data.
- PostgreSQL / MySQL: Open-source relational databases widely used by startups and local IT companies in Nepal for storing application data.
- Google BigQuery: Cloud-based data warehouse capable of running SQL queries across billions of rows in seconds. Increasingly used by Nepal's IT outsourcing sector.
- Snowflake: Enterprise data warehouse platform favoured by larger organisations for its scalability and multi-cloud support.
SQL is not optional for data analysts. It is the single most consistently required skill across every data analytics job posting globally and in Nepal.
2. Programming Languages: Python and R
Python is the most in-demand programming language for data analytics globally and the primary technical language taught in every serious data analytics course today. Its data-focused libraries form the analytical engine behind most professional data work:
- pandas: Data manipulation loading, cleaning, reshaping, and aggregating datasets.
- NumPy: Numerical computing performing fast mathematical operations on arrays and matrices.
- matplotlib / seaborn / Plotly: Data visualisation building charts, plots, and interactive graphics programmatically.
- Scikit-learn: Machine learning building and evaluating predictive models.
R is equally powerful for statistical analysis and is preferred in academic research and certain financial analytics roles. For most beginners in Nepal targeting local jobs or remote data analytics roles, Python is the right starting point.
3. Business Intelligence Platforms: Power BI, Tableau, Looker
These are the data analytics software tools that business stakeholders interact with daily. They connect to databases and data warehouses and allow analysts to build interactive dashboards without writing code for every chart.
- Microsoft Power BI: The most widely deployed BI tool in Nepal's corporate sector. Integrates natively with Excel and Microsoft 365. The DAX formula language gives analysts powerful calculated fields and custom measures.
- Tableau: Industry-leading visualisation platform known for its drag-and-drop interface and ability to handle complex, large datasets. Strong demand in global remote roles.
- Google Looker Studio: Free, cloud-native BI tool that connects to Google Analytics, BigQuery, and Google Sheets. An excellent starting point for beginners.
For data analytics professionals in Nepal targeting both local companies and remote international roles, Power BI is the most practical tool to learn first, followed by Tableau for global market positioning.
4. Spreadsheet Tools: Excel and Google Sheets
Microsoft Excel remains the most universally used data analytics tool across every industry and company size globally. Pivot tables, VLOOKUP/XLOOKUP, Power Query, and basic statistical functions make Excel the entry point for every data analytics beginner and a daily tool for experienced analysts working in business environments.
Google Sheets provides the same core functionality in a cloud-native, collaborative format. Both tools are foundational, and dismissing them as "too basic" is a mistake that many beginners make before discovering how much analytical power they actually contain.
5. Statistical and Machine Learning Libraries
For analysts moving beyond descriptive work into predictive data analytics:
- Scikit-learn: The standard Python library for building regression, classification, and clustering models.
- Statsmodels: Statistical testing, hypothesis analysis, and regression diagnostics in Python.
- TensorFlow / PyTorch: Deep learning frameworks for analysts building neural network-based systems.
What is a Data Analytics Project?
You cannot build a career in data analytics from tutorials alone. To demonstrate genuine capability to employers whether local companies in Kathmandu or remote international clients you must complete real end-to-end data analytics projects that show every layer working together.
Top Project Ideas for Data Analytics Learners:
Nepal E-Commerce Sales Analysis: Pull transaction data from a public dataset, clean it with pandas, and build a Power BI dashboard showing revenue by category, region, and time period. Answer a specific business question which product category has the highest return rate?
- Customer Churn Prediction: Use a publicly available telecom dataset from Kaggle, clean and explore it in Python, build a logistic regression model in Scikit-learn to predict which customers are likely to leave, and visualise the key churn drivers in a dashboard.
- Nepal Job Market Analysis: Scrape or download IT job posting data from Nepali job portals, clean it in pandas, and build an analysis of which skills are most in-demand, which cities post the most roles, and how salary ranges compare across different specialisations.
- Financial Performance Dashboard: Take a company's publicly available financial data, load it into Power BI or Tableau, and build an executive dashboard showing revenue trends, cost breakdowns, and profitability by quarter.
Each project should be fully documented on GitHub with a clear README explaining the business question, data sources, methodology, and findings. This is your data analytics portfolio the single most important thing that gets you hired.
What Does a Data Analytics Specialist Do?
A professional data analytics specialist bridges the gap between raw data and business action. On a normal working day, responsibilities look like this:
- Writing SQL queries to extract and aggregate data from business databases and data warehouses.
- Cleaning and preparing datasets in Python or Excel for analysis.
- Building and maintaining dashboards in Power BI or Tableau that stakeholders use to monitor business performance.
- Conducting diagnostic analysis to identify the root cause of business problems revenue drops, customer churn spikes, operational inefficiencies.
- Presenting findings to non-technical stakeholders and recommending data-backed actions.
- Collaborating with data engineers to ensure the right data is being collected and stored correctly.
- Staying current with new data analytics tools and techniques relevant to the business.
The role spans every industry. A data analytics specialist at a Nepali bank focuses on transaction data and fraud patterns. The same role at an e-commerce company focuses on customer behaviour and product performance. The underlying skill set is identical the domain knowledge is what changes.
Data Analytics in the Age of AI: Will It Be Replaced?
With the rapid rise of generative AI tools, many students ask the same question: will AI replace data analysts? The direct answer is no. AI is changing how analysts work not making them irrelevant.
How AI is Transforming Data Analytics Work
AI-powered tools like Microsoft Copilot for Power BI, Google's Gemini integrations in BigQuery, and Python-based AI libraries are automating many of the repetitive tasks that used to consume analyst time generating standard SQL queries, producing first-draft reports, summarising datasets in plain language, and flagging anomalies automatically.
For data analytics professionals, this is an opportunity, not a threat. Analysts who learn to use AI as a productivity multiplier combining their domain knowledge and business communication skills with AI-assisted analysis are becoming significantly more valuable than those who only know how to run queries manually.
Why Human Analysts Remain Essential
Despite advances in AI, no automated system can independently understand a business context, question the validity of its own data sources, navigate organisational politics to get the right information, or communicate nuanced findings to a nervous CFO. Those capabilities require human judgment, domain expertise, and professional communication skills that no AI tool currently replicates.
The future of data analytics belongs to professionals who combine strong technical fundamentals SQL, Python, visualisation, statistical thinking with the ability to use AI tools intelligently. Learning data analytics now, with that combination in mind, is a stronger career investment in 2026 than it has ever been.
How to Start Your Data Analytics Journey: Training and Courses
Ready to move from reading about data analytics to actually building skills? Here is how to map your approach.
Following the Data Analytics Roadmap
To avoid overwhelming yourself with too many tools at once, follow this structured data analytics roadmap phase by phase:
- The Foundations: Start with Excel and Google Sheets to understand how data is structured. Learn basic statistics mean, median, variance, and what correlation actually means.
- SQL and Databases: Learn to query relational databases, join tables, filter records, and aggregate data. SQL is non-negotiable and the fastest skill to turn into employment.
- Python for Analysis: Work through pandas and NumPy for data manipulation, then matplotlib and seaborn for visualisation. Build at least one complete data analytics project before moving on.
- BI Tools and Dashboarding: Learn Power BI or Tableau. Build interactive dashboards connected to real data sources. Design reports that non-technical people can use confidently.
- Statistics and Predictive Analytics: Apply hypothesis testing, regression analysis, and basic machine learning concepts to real business questions. This phase bridges data analytics into data science territory.
Choosing the Right Data Analytics Courses
Thousands of data analytics courses online are available free, paid, self-paced, and instructor-led. A data analytics free course on Coursera or Kaggle is excellent for building initial interest. However, self-study consistently hits a wall when you encounter complex, real-world data problems that a YouTube tutorial cannot solve. A structured, mentorship-backed data analytics training programme gives you access to hands-on code review, industry-guided projects, and career support that self-study simply cannot provide.
For learners in Nepal, the choice between an online data analytics full course and an in-person programme at a local data analytics institute depends on your learning style. Both can produce job-ready skills the key is consistent practice and real project completion, not just watching recorded lectures.
Industry-Recognised Data Analytics Certifications
Completing a recognised data analytics certification validates your skills to employers beyond just listing tools on a resume. The top certifications for 2026 are:
- Google Data Analytics Professional Certificate (Coursera): Best for complete beginners. Covers Excel, SQL, R, and Tableau.
- Microsoft Power BI Data Analyst Associate (PL-300): Best for professionals targeting BI-heavy roles. Validates real dashboard development skills.
- IBM Data Analyst Professional Certificate (Coursera): Strong technical depth in Python, SQL, and IBM Cognos.
Why Data Analytics is One of the Best Career Choices in Nepal
There are plenty of career directions in tech and business. However, why data analytics stands out especially in Nepal comes down to clear, practical advantages:
- Universal Demand Across Industries: Every sector in Nepal banking, telecom, e-commerce, government, healthcare, IT outsourcing now generates data that needs qualified analysis. The data analytics jobs market is not confined to one industry.
- Remote Work Accessibility: Data analytics is one of the most remote-compatible disciplines in all of business and IT. Data analytics remote jobs with international clients in Europe, the US, and Australia are fully accessible from Nepal, often at pay rates significantly higher than the local market.
- Clear Learning Path: Unlike some IT disciplines, where the path from beginner to employed is ambiguous, data analytics has a well-defined roadmap Excel → SQL → Python → BI tools → statistics → projects → employment.
- Strong Salary Progression: Entry-level data analytics salary in Nepal starts at NPR 30,000 to 55,000 per month. Mid-level professionals earn NPR 70,000 to 1,30,000. Senior specialists and analytics leads reach NPR 1,30,000 to 3,00,000 or more with remote roles for international clients pushing significantly beyond local market rates.
- Business Data Analytics Connects You to Strategy: Data analytics business professionals sit at the intersection of every function marketing, finance, operations, product. That cross-functional visibility makes skilled analysts some of the hardest people to replace in any organisation, and the fastest to build strategic career momentum.
Conclusion
Data analytics remains one of the clearest, most accessible paths into a high-value tech and business career whether you are targeting local companies in Kathmandu, data analytics intern opportunities to build your first experience, or remote roles with international clients. While AI is fundamentally changing how repetitive analysis tasks get done, the market continues to reward professionals who can translate business questions into reliable data insights and communicate those findings clearly to decision-makers.
If you are ready to move from curiosity about data to actually building real skills, stop reading tutorials and start working with real datasets. Explore the Business Data Analytics with AI Course at Skill Shikshya today, connect with expert instructors who have worked in the field, and build the portfolio that will launch your data analytics career.
Frequently Asked Questions
What is data analytics in simple terms?
What are the four types of data analytics?
Do I need coding skills to learn data analytics?
Which data analytics tool should I learn first?
Is data analytics a good career in Nepal?
How long does it take to learn data analytics?
What is the difference between data analytics and data science?
Are there free data analytics courses available?
About Author: