What is Business Intelligence? A Complete Guide for Beginners | Skill Shikshya
Walk into almost any company today, whether it is a commercial bank in Kathmandu or a multinational retailer, and you will hear the term "business intelligence" thrown around in meetings. Dashboards, KPIs, reports, BI tools, BI advisors. But what does it actually mean, and why does seemingly every company suddenly need it?
If you are exploring data analytics as a career, trying to understand why your company keeps investing in BI software, or actively searching for data analytics courses in Nepal that touch on business intelligence, this guide breaks down exactly what business intelligence is, how it works, the tools professionals use, and where it fits inside the broader world of data analytics.
For the bigger-picture view of how business intelligence connects to the wider discipline, our guide on what data analytics is covers the four core types of analytics, the tools, and the career paths in detail. If you are ready to start building hands-on skills now, explore our Business Data Analytics with AI Course in Nepal, designed to take you from complete beginner to job-ready analyst.
What is Business Intelligence?
So, what is business intelligence at its core? Business intelligence, or BI, is the combination of technology, tools, and processes that organizations use to collect, organize, and analyze business data so leaders can make faster, evidence-based decisions. Instead of a manager guessing why sales dropped or relying on a gut feeling about customer behavior, business intelligence turns raw company data into dashboards, reports, and metrics that show exactly what is happening, in close to real time.
Business intelligence means converting numbers sitting in databases, spreadsheets, and business systems into something a human being can actually look at and use. It is the bridge between "we have data" and "we know what to do because of that data."
Business Intelligence Means More Than Just Software
A common misconception is that business intelligence is simply a piece of software you buy and install. In reality, business intelligence means a combination of three things working together: the data infrastructure that stores and organizes company information, the BI tools and software that query and visualize that data, and the people and processes that interpret the output and turn it into decisions. A company can own the most expensive BI software on the market and still get zero value from it if nobody understands how to ask the right questions of the data or act on what the dashboard shows.
This is why business intelligence is best understood as a discipline, not a product. The software is one piece. The strategy, the data quality, and the human judgment applied to the output are what actually make business intelligence work.
Where Does Business Intelligence Fit in Data Analytics?
Business intelligence and data analytics overlap heavily, and beginners often use the two terms interchangeably, but there is a useful distinction. Business intelligence is generally focused on monitoring what is happening in a business right now and what has already happened, using dashboards, scorecards, and reports built on structured company data. Data analytics is the broader discipline, and it includes BI but also extends into deeper diagnostic work, predictive modeling, and statistical analysis that goes beyond a standard dashboard.
In practice, most business intelligence work falls under descriptive and diagnostic analytics. It answers "what happened" and "why did it happen," using historical and current data. If you want a full breakdown of how business intelligence relates to the four core types of data analytics, our guide on data vs business analytics walks through the distinction in more depth.
How Business Intelligence Actually Works
Understanding how business intelligence works in practice matters more than memorizing a definition. Here is the typical flow of business intelligence inside a real company:
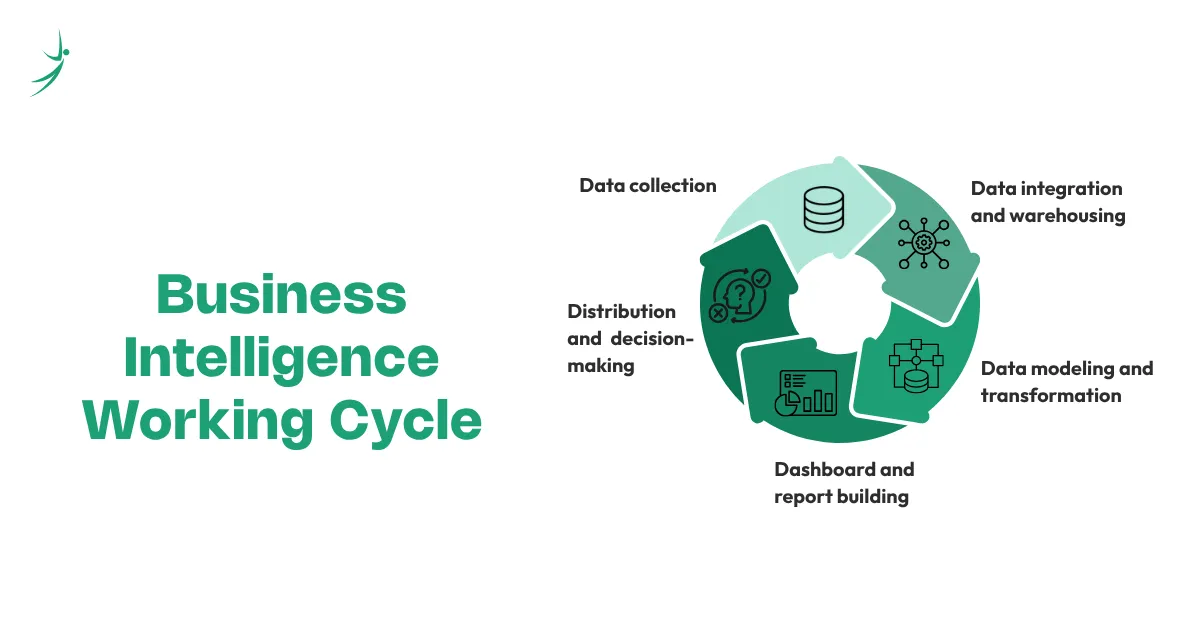
- Data collection from business systems: BI pulls data from sources like sales databases, CRM platforms, ERP systems, e-commerce platforms, and financial software. In Nepal's growing tech and finance sector, this often means banking transaction systems, retail point-of-sale data, and digital marketing platforms.
- Data integration and warehousing: Data from multiple systems gets combined into a central data warehouse or data lake so it can be queried consistently, rather than living in disconnected spreadsheets across different departments.
- Data modeling and transformation: Raw data gets cleaned, structured, and organized into a format that BI tools can actually work with, often using SQL or built-in transformation features inside the BI platform itself.
- Dashboard and report building: Using a BI tool, analysts build visual dashboards, scorecards, and automated reports that present key metrics in a format business stakeholders can understand at a glance.
- Distribution and decision-making: Dashboards get shared with managers, executives, and teams, who use the insight to make decisions, adjust strategy, or flag problems before they grow.
This is the same general workflow whether the company is a small Kathmandu startup tracking monthly revenue in a simple dashboard, or a global bank running enterprise-grade business intelligence advisors and consulting teams who design BI strategy across hundreds of departments. It is worth being clear about that last term, since "business intelligence advisors" specifically also refers to a well-known institutional research firm that analyzes investor and executive communications, which is a different and unrelated use of the phrase. In the data analytics context this guide covers, BI advisors generally means consultants or in-house specialists who help organizations design, implement, and interpret their business intelligence systems.
Why Companies Need Business Intelligence
The business case for BI is straightforward once you see it in action.
- Faster decision-making: Instead of waiting weeks for a manually compiled report, decision-makers see live or near-live dashboards and can act immediately.
- Reduced reliance on guesswork: Business intelligence replaces opinion-based decisions with evidence from actual company data.
- Early problem detection: A well-built BI dashboard flags a revenue drop, a spike in customer complaints, or an inventory shortage before it becomes a crisis.
- Cross-departmental visibility: Marketing, finance, operations, and sales can all see the same source of truth instead of working from conflicting numbers.
- Competitive advantage: Companies that can read and respond to their own data faster than competitors consistently outperform those still running on instinct and outdated reports.
Business Intelligence Tools and Software
This is the part most beginners are actually curious about: which BI tools and which data analytics software do professionals use day to day?
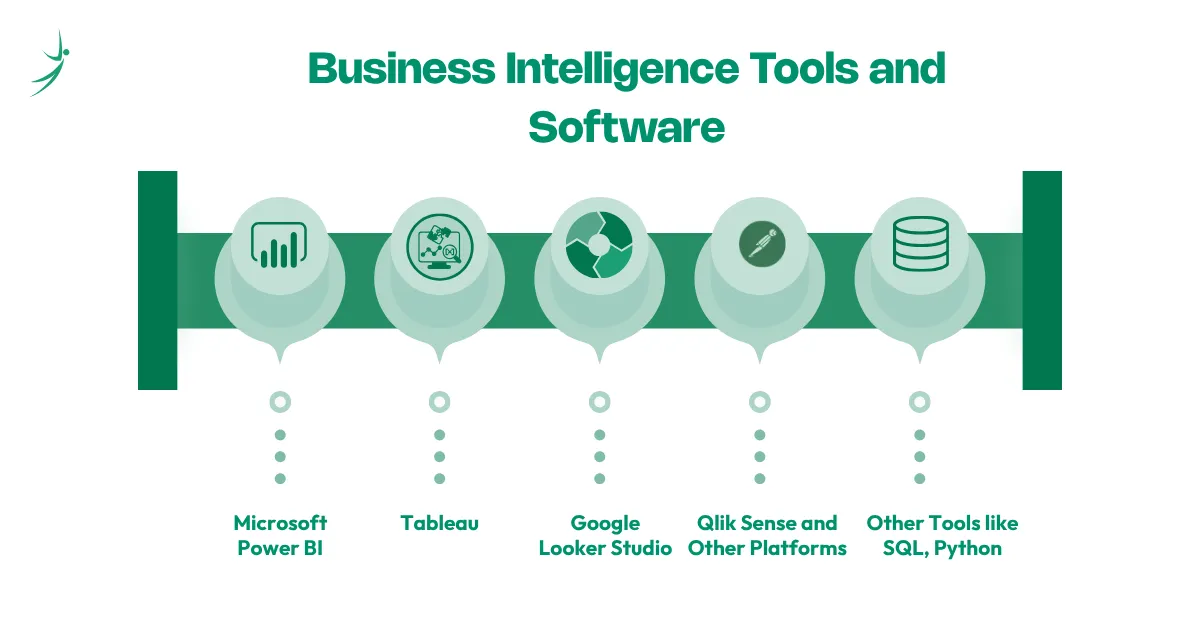
Microsoft Power BI
Power BI is the most widely deployed business intelligence tool in Nepal's corporate sector and one of the dominant BI platforms globally, holding the largest market share among BI tools worldwide as of 2026. It integrates natively with Excel and the Microsoft 365 ecosystem, and its DAX formula language gives analysts the ability to build custom calculated fields and measures. For most beginners and for companies already using Microsoft tools, Power BI is the most practical starting point.
Tableau
Tableau, now owned by Salesforce, is known for its drag-and-drop visual analytics and its ability to handle large, complex datasets with strong visual flexibility. It remains one of the leading business intelligence and data visualization platforms by market share, and it is in strong demand for global remote roles, even though Power BI tends to dominate in price-sensitive markets like Nepal's.
Google Looker Studio
Looker Studio is a free, cloud-native BI tool that connects directly to Google Analytics, Google BigQuery, and Google Sheets. It is an excellent entry point for beginners who want to experiment with business intelligence concepts without any upfront software cost, which makes it a frequent feature in data analytics free courses.
Qlik Sense and Other Platforms
Beyond the big two, platforms like Qlik Sense, ThoughtSpot, and Zoho Analytics round out the modern BI tools landscape, each focused on different niches such as associative data exploration, natural-language search-driven analytics, or smaller-business affordability. As of 2026, AI features like natural-language querying and automated insight generation have become standard across nearly all major BI tools, narrowing the feature gap between platforms and shifting the real differentiator toward ease of use, pricing, and ecosystem fit.
Supporting Data Analytics Tools
Business intelligence platforms rarely work in isolation. They sit on top of a wider data analytics tools ecosystem that includes:
- SQL for querying and aggregating data from databases and data warehouses.
- Excel and Google Sheets for quick, structured analysis and manual data handling.
- Python, particularly libraries like pandas, for automating data cleaning and preparation before it ever reaches a BI dashboard.
Business Intelligence Career Paths and Roles
Business intelligence work shows up under several different job titles, and beginners often do not realize how many of these overlap with data analytics roles:
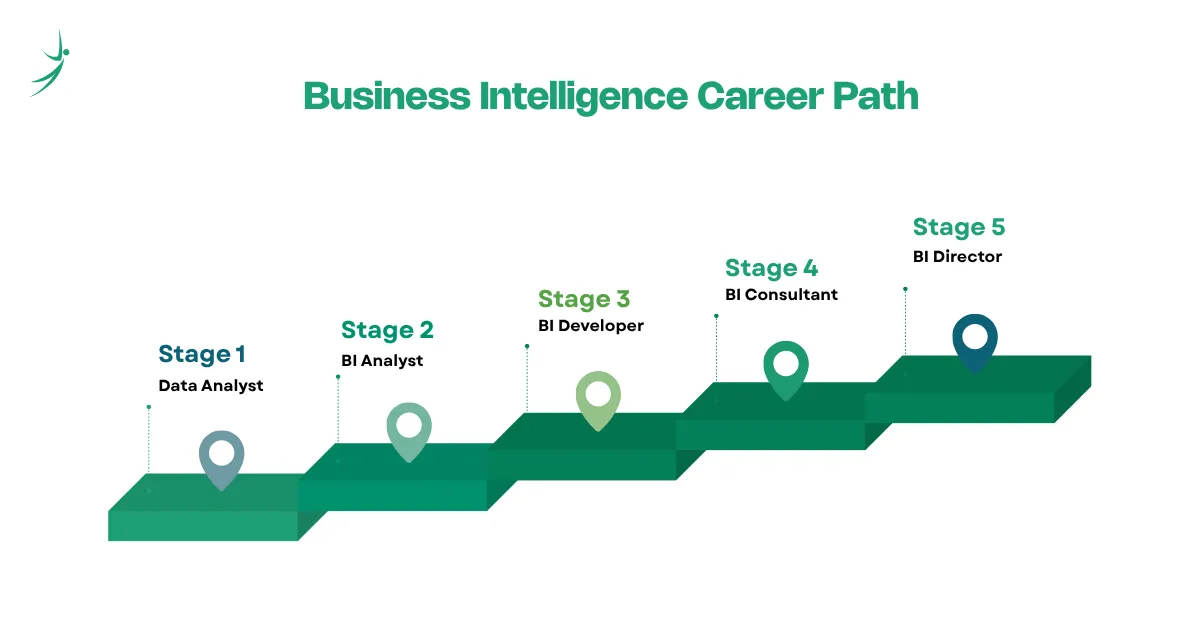
- BI Analyst / Business Intelligence Analyst: Builds and maintains dashboards, writes SQL queries, and works directly with business stakeholders to define what metrics matter.
- BI Developer: Focuses more heavily on the technical backend, building data models, ETL pipelines, and the infrastructure that feeds BI dashboards.
- Data Analyst: A closely related role that often performs BI work alongside deeper diagnostic and exploratory analysis.
- BI Consultant / BI Advisor: Works across multiple companies or departments helping design BI strategy, select the right tools, and train internal teams, distinct from the institutional research firm of the same descriptive name mentioned earlier.
- Director of Business Intelligence: Aligning all data and BI initiatives with high-level corporate objectives, managing analytics budgets, setting data security and governance policies, and leading entire teams of analysts, developers, and architects.
Business Intelligence and Data Analytics Salary in Nepal
For anyone evaluating this as a career path, salary is usually the deciding factor, so here is a realistic picture based on the current Nepal job market.
- Entry-level data analytics salary in Nepal, which includes most BI-focused entry roles, typically falls between NPR 30,000 and NPR 55,000 per month.
- Mid-level professionals with BI tool expertise and a few years of experience generally earn NPR 70,000 to NPR 1,30,000 per month.
- Senior data analytics and BI specialists, including team leads managing dashboard strategy across departments, can reach NPR 1,30,000 to NPR 3,00,000 or more per month.
- Remote roles for international clients consistently push beyond these local figures, particularly for analysts who are strong in Power BI, Tableau, and SQL combined.
Business intelligence-specific roles tend to sit comfortably within this same data analytics salary band in Nepal, since most companies hiring locally do not separate "BI Analyst" and "Data Analyst" into distinct pay scales.
Business Intelligence in the Age of AI
A natural question for anyone starting now: is business intelligence still worth learning when AI tools can generate charts and summaries automatically?
The honest answer is yes, and AI is actually expanding the value of BI skills rather than replacing them. Tools like Power BI Copilot now let users generate reports, build calculated measures, and summarize datasets using plain-language prompts, while AI features across nearly every major BI tool can flag anomalies and surface insights automatically. This shifts business intelligence work away from manually building every chart from scratch and toward higher-value tasks: deciding which metrics actually matter to the business, validating that the data behind a dashboard is trustworthy, and translating AI-generated insight into a recommendation a non-technical executive will actually act on. Professionals who combine BI tool fluency with strong business judgment are becoming more valuable, not less, as AI takes over the repetitive parts of the job.
How to Start Learning Business Intelligence
If you are ready to move from understanding business intelligence to actually building BI skills, here is a sensible path to follow:
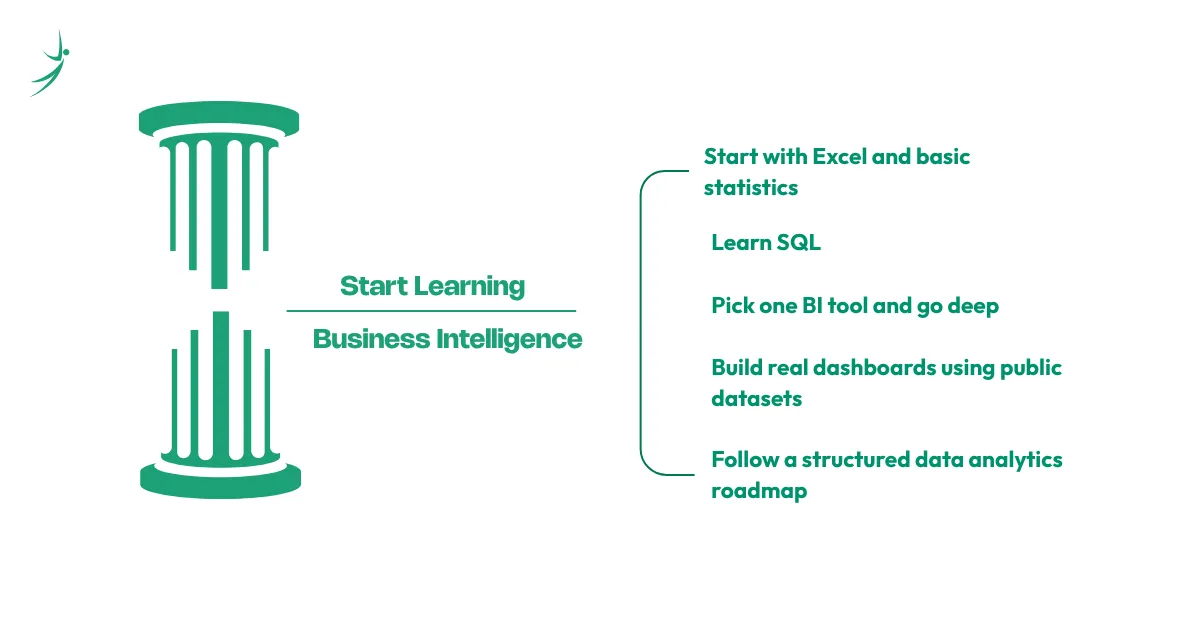
- Start with Excel and basic statistics to understand how structured business data behaves before touching any BI software.
- Learn SQL so you can query and prepare the data that eventually feeds into a BI dashboard.
- Pick one BI tool and go deep, ideally Power BI first given its dominance in Nepal's job market, then Tableau if you are targeting international remote roles.
- Build real dashboards using public datasets, not just tutorial data, and document the business question each dashboard answers.
- Follow a structured data analytics roadmap rather than learning tools randomly, since BI skills only become valuable when paired with the surrounding data analytics fundamentals like data cleaning, SQL, and basic statistics.
Choosing the Right Data Analytics Courses
There is no shortage of data analytics courses online, including free options on platforms like Coursera and Kaggle that are genuinely useful for testing your interest in BI and analytics before committing further. However, self-paced learning tends to hit a wall once you encounter messy, real-world data problems that a short tutorial does not cover. This is where structured, mentor-led data analytics courses in Nepal make a measurable difference, giving learners hands-on project feedback, real dataset experience, and direct career guidance that free content alone cannot replicate.
When evaluating which data analytics best courses to choose, look for programs that combine BI tool training like Power BI with the surrounding fundamentals (SQL, Python, statistics) rather than courses that teach a single tool in isolation. Business intelligence skills on their own are useful, but they become genuinely job-ready when paired with a complete data analytics overview that covers the full process from raw data to dashboard to decision.
Conclusion
Business intelligence is not a buzzword or a single piece of software. It is the practical discipline of turning a company's raw data into dashboards, reports, and metrics that real decision-makers actually use, every single day. Whether you are evaluating BI as part of a broader data analytics career or simply trying to understand why your workplace keeps talking about dashboards and KPIs, the core idea stays the same: better visibility into data leads to better decisions, faster.
If you are ready to move from reading about business intelligence to actually building it, explore the Business Data Analytics with AI Course at Skill Shikshya, where you will work hands-on with Power BI, SQL, and Python, build real dashboards, and learn directly from instructors with industry experience.
Frequently Asked Questions
What is business intelligence in simple terms?
What does business intelligence mean compared to data analytics?
What are the most popular business intelligence tools?
Do I need coding skills for business intelligence?
What is the salary for a business intelligence or data analytics role in Nepal?
Are there free courses to learn business intelligence?
Is "business intelligence advisors" the same as a BI consultant?
About Author: