DevOps Interview Questions (2026): Q&A, Tips & Examples
DevOps interview rounds are not just about naming tools. Interviewers test how you think when a pipeline breaks, how you collaborate when Dev and Ops disagree, and whether you understand why a tool exists - not just what it does.
The demand for DevOps engineers in Nepal and globally is growing fast. Senior DevOps roles in Nepal now pay between NPR 1,50,000 and 2,50,000 per month, and companies are actively hiring at every level, from interns to cloud architects. But landing that role requires more than reading documentation.
Whether you are sitting for your first DevOps internship interview or targeting a senior cloud engineering position, this guide covers everything; concepts, tools, scenario questions, and preparation tips - broken down by experience level.
Not sure where DevOps fits in your career path yet? Start with our complete guide on how to get into DevOps before diving into interview prep. And when you are ready to build hands-on skills, our DevOps and Cloud diploma program gives you real pipelines, real tools, and real projects to talk about in interviews.
How to Prepare for a DevOps Interview
Memorizing definitions is not enough. Companies want engineers who can apply DevOps principles to real infrastructure problems. Here is what you need to do before you walk into the room.
1. Core Concepts You Must Know
Before anything else, you need to be solid on the fundamentals - not just able to define them, but able to explain them clearly without a script.
- Understand the full DevOps lifecycle: Plan → Code → Build → Test → Deploy → Monitor and what happens at each stage
- Know the difference between Continuous Integration, Continuous Delivery, and Continuous Deployment - these three come up in almost every interview
- Be fluent in CALMS; Culture, Automation, Lean, Measurement, Sharing - the framework that defines DevOps as a culture, not just a set of tools
- Understand Infrastructure as Code (IaC), containerization, container orchestration, and GitOps at a conceptual level before you go into tool specifics
A clear understanding of what DevOps actually is and how it works gives you a foundation that connects every tool and practice you learn after it.
2. Tools You Should Be Familiar With
Interviewers at most Nepal-based IT companies and global remote roles expect you to speak confidently about the tools you have actually used - not just tools you have heard of. Structure your preparation by category:
- CI/CD: Jenkins, GitLab CI, GitHub Actions
- Containerization: Docker, Docker Compose
- Orchestration: Kubernetes
- Infrastructure as Code: Terraform, Ansible
- Monitoring & Observability: Prometheus, Grafana, ELK Stack (Elasticsearch, Logstash, Kibana)
- Version Control: Git, GitHub, GitLab
For each tool, prepare one real example of how you used it - even in a home lab or training project. Saying "I set up a Jenkins pipeline that builds and tests a Node.js app on every Git push" is far stronger than "I know Jenkins."
Check out our breakdown of the most important DevOps tools and what each one does for a deeper look at how these fit together.
3. Building and Presenting Your Portfolio
In Nepal's current IT hiring market, a working portfolio beats a certification every time. Interviewers want proof that you can do the work, not just that you passed a test.
What makes a strong DevOps portfolio:
- GitHub repositories with real Dockerfiles, Terraform configs, CI/CD pipeline YAML files, and Kubernetes manifests - with clear README files explaining what each project does
- Screenshots of working setups, a Grafana dashboard you built, a Jenkins pipeline that runs tests automatically, a Docker Compose stack that spins up a full web app
- Home lab documentation, even a Kubernetes cluster running on Minikube or a self-hosted GitLab instance shows initiative and hands-on thinking
- Scripting work, Bash scripts that automate server checks, deployments, or log parsing show that you think like an engineer, not just an operator
Practical DevOps skills get you interviews. A portfolio gets you offers.
4. Researching the Company Before the Interview
Before you walk in, know exactly what stack the company uses. Read the job posting carefully - every tool they mention is a potential interview question.
- If the JD mentions Kubernetes heavily, prepare 5–6 Kubernetes-specific answers and at least one real example
- If they are AWS-heavy, revise AWS services - EC2, ECS, ECR, Lambda, CodePipeline
- Research how often they deploy, whether they use microservices, and what their current infrastructure challenges are
- Prepare 2–3 questions to ask them - it shows you think strategically, not just technically
Map your preparation to their DevOps roadmap and their current stage - early-stage startup infrastructure looks very different from a mature enterprise pipeline.
Top 20 DevOps Interview Questions (Quick Answers)
These are the questions that come up across every level - fresher, mid-level, and senior. Understand the concepts well enough to explain them without reading from a script. Interviewers always follow up.
Q1. What is DevOps and why does it matter?
DevOps is a set of practices, cultural values, and tools that bring development and operations teams together to deliver software faster and more reliably. Before DevOps, developers wrote code and handed it to an operations team that deployed and maintained it separately. That wall between the two teams caused slow releases, finger-pointing when deployments broke, and long feedback loops.
DevOps removes that wall. Teams share ownership of the entire lifecycle - from writing code to keeping it running in production. The result is faster delivery, fewer failures, and quicker recovery when things do go wrong.
Q2. How is DevOps different from traditional IT?
In traditional IT, development and operations work in silos. Developers write code in one team, operations deploy and maintain it in another. Releases happen quarterly or monthly, documentation is heavy, and communication between teams is mostly through tickets.
DevOps combines those responsibilities. Developers care about how their code runs in production. Operations engineers get involved earlier in the development cycle. Releases happen continuously, sometimes multiple times a day and feedback flows both ways in real time.
Q3. What are the key principles of DevOps? (CALMS)
CALMS is the most widely accepted framework for describing what DevOps actually means in practice:
- Culture: shared ownership across Dev, Ops, QA, and Security. No blame culture; teams own outcomes together
- Automation: remove every manual, repetitive step from the delivery pipeline
- Lean: eliminate waste, keep work moving, deliver in small batches
- Measurement: track deployment frequency, lead time, failure rate, and recovery time. Improve based on data, not gut feel
- Sharing: open communication, shared tools, shared knowledge across teams
Q4. What is the DevOps lifecycle? Walk me through each phase.
- Plan: Define what to build, prioritize work, break it into small deliverables
- Code: Developers write and commit code to a version-controlled repository
- Build: Automated tools compile the code and package it for testing
- Test: Automated tests run to catch bugs, performance issues, and security gaps before deployment
- Deploy: The tested build goes to staging or production automatically via a CI/CD pipeline
- Monitor: System performance, errors, and user behavior get tracked in real time, feeding insights back into the next planning cycle
Q5. What is the difference between CI, CD, and Continuous Deployment?
Three terms that sound similar but mean different things:
- Continuous Integration (CI): developers merge code into a shared repository frequently, usually multiple times a day. Every merge triggers an automated build and test run. The goal is to catch integration issues early.
- Continuous Delivery (CD): every code change that passes automated tests is packaged and ready to deploy to production at any time. A human still approves the final release.
- Continuous Deployment: goes one step further. Every change that passes tests deploys to production automatically, with no human approval step. Companies like Netflix and Amazon run at this level.
Q6. What is Infrastructure as Code (IaC) and why is it used?
IaC is the practice of defining and managing infrastructure - servers, databases, networks, load balancers - using code instead of manual configuration.
Instead of logging into an AWS console and clicking through to create a server, you write a Terraform file that describes the infrastructure you want. Running that file creates it, every time, consistently.
IaC solves three problems: it makes infrastructure reproducible, it puts infrastructure changes under version control, and it eliminates the "snowflake server" problem where no one knows exactly how a production server was configured.
Q7. What is a container and how is it different from a virtual machine?
A container is a lightweight, isolated environment that packages an application and everything it needs to run - libraries, dependencies, runtime - into a single unit. It shares the host operating system's kernel, which makes it fast to start and cheap to run.
A virtual machine emulates an entire computer, running a full guest OS on top of the host OS through a hypervisor. VMs are heavier, slower to start, and use more resources - but they offer stronger isolation.
For most modern application deployment, containers are faster and more practical. VMs still make sense when you need full OS-level isolation or are running legacy software.
Q8. What is Docker and what problem does it solve?
Docker is the most widely used containerization platform. It lets you package an application and all its dependencies into a container that runs identically on any machine - your laptop, a server, or a cloud platform.
It solves the "it works on my machine" problem. Before Docker, code that ran fine on a developer's laptop often broke on a server because of environment differences. Docker eliminates those differences entirely.
For a deeper look, our Docker for beginners guide covers containers, images, Dockerfile writing, and Docker Compose from scratch.
Q9. What is Kubernetes and when do you need it?
Kubernetes is a container orchestration platform. Docker runs containers. Kubernetes manages them at scale - scheduling containers across multiple servers, restarting failed ones automatically, scaling up when traffic increases, and rolling out updates without downtime.
You need Kubernetes when you are running many containers across multiple servers and need automated management. For a single container on one server, Docker alone is enough. For 50 services running across a production cluster, Kubernetes is what keeps everything stable and organized.
For a deeper look, our Kubernetes for beginners guide covers Pods, Deployments, Services, and scaling from scratch.
Q10. What is a CI/CD pipeline and how does it work end to end?
A CI/CD pipeline is an automated workflow that takes code from a developer's commit to a live deployment without manual steps.
A typical pipeline runs like this:
- Developer pushes code to a Git repository
- The pipeline triggers automatically (via GitHub Actions, Jenkins, or GitLab CI)
- Code gets compiled and built
- Automated unit and integration tests run
- If tests pass, the build gets packaged into a Docker image
- The image gets pushed to a registry (Docker Hub or AWS ECR)
- The image deploys to a staging environment for review
- On approval (or automatically in Continuous Deployment), it goes to production
For a complete breakdown of how CI/CD works from code commit to live deployment, our CI/CD guide covers every stage in detail.
Q11. What is configuration management and which tools handle it?
Configuration management is the practice of keeping servers and infrastructure in a known, consistent state. Instead of manually configuring each server, you define the desired state in code and let a tool enforce it.
Common tools:
- Ansible: uses YAML playbooks, agentless, runs over SSH
- Puppet: uses a declarative language, requires an agent on each managed server
- Chef: uses Ruby-based recipes, steep learning curve but highly flexible
Ansible is the most common starting point in Nepal's DevOps job market.
Q12. What is the difference between Terraform and Ansible?
Both are infrastructure automation tools, but they solve different problems:
- Terraform: provisions infrastructure. It creates and manages cloud resources: servers, databases, VPCs, load balancers. It is declarative - you describe what you want, Terraform figures out how to get there.
- Ansible: configures software on existing infrastructure. Once Terraform creates a server, Ansible installs packages, configures services, and manages application deployments on it.
A common pattern: use Terraform to create the infrastructure, then Ansible to configure it.
Q13. What is Git branching strategy? Explain GitFlow.
A branching strategy defines how teams manage code changes in a shared repository. GitFlow is the most widely used:
- main: production-ready code only. Every commit here is a live release.
- develop: the integration branch. All feature work merges here first.
- feature branches: one branch per feature, created from develop, merged back into develop when complete
- release branches: cut from develop when a release is ready. Only bug fixes go here.
- hotfix branches: cut from main when an urgent production bug needs fixing
GitFlow works well for teams with scheduled releases. Teams doing Continuous Deployment often use a simpler trunk-based development model instead.
Q14. What is blue-green deployment?
Blue-green deployment is a release strategy that keeps two identical production environments running - blue (current live) and green (new version).
When you want to release a new version, you deploy it to the green environment, run tests, and then switch the traffic from blue to green. If something goes wrong, you switch traffic back to blue immediately. Zero downtime, instant rollback.
The downside is cost - you run two full environments at the same time.
Q15. What is a canary release?
A canary release gradually rolls out a new version to a small percentage of users first - say 5% - before releasing it to everyone.
If the 5% shows no errors or performance issues, you gradually increase the rollout to 25%, then 50%, then 100%. If something breaks, you roll back only the affected percentage. It reduces risk significantly compared to releasing to all users at once.
Q16. What are the three pillars of observability?
Observability is your ability to understand what is happening inside a system based on its outputs. The three pillars are:
- Metrics: numerical measurements over time: CPU usage, request rate, error rate, latency. Prometheus collects and stores metrics.
- Logs: timestamped records of events that happened inside your system. The ELK Stack (Elasticsearch, Logstash, Kibana) is the most common log management setup.
- Traces: records of a request's journey through a distributed system, showing which services it passed through and how long each step took. Tools like Jaeger and Zipkin handle distributed tracing.
Monitoring tells you when something is wrong. Observability helps you understand why.
Q17. What is DevSecOps?
DevSecOps integrates security into every stage of the DevOps pipeline instead of treating it as a final checkpoint before release.
In a DevSecOps workflow, security scans run automatically inside the CI/CD pipeline: static code analysis checks for vulnerabilities in the code, dependency scanning flags outdated or insecure libraries, and container scanning checks Docker images for known vulnerabilities before they deploy.
The goal is to find and fix security issues when they are cheapest to fix - during development, not after a breach.
Q18. What is GitOps?
GitOps is a way of managing infrastructure and deployments using Git as the single source of truth. Instead of running deployment commands manually or through a CI/CD pipeline that pushes changes, GitOps tools like ArgoCD or Flux pull the desired state from a Git repository and continuously reconcile it with what is actually running in the cluster.
If someone manually changes a Kubernetes resource directly, GitOps detects the drift and reverts it to match the repository. Infrastructure stays exactly as declared in Git.
Q19. How do you handle rollback in a failed deployment?
The answer depends on the deployment strategy:
- Blue-green: switch traffic back to the old environment immediately
- Canary: stop the rollout and reroute all traffic to the stable version
- Kubernetes rolling update: run kubectl rollout undo deployment/<name> to revert to the previous ReplicaSet
- Feature flags: disable the feature for all users instantly without redeploying
The most important thing is that rollback is practiced and automated before it is needed, not figured out during an incident.
Q20. What are the most important DevOps KPIs?
The four DORA metrics are the industry standard for measuring DevOps performance:
- Deployment Frequency: how often you deploy to production. High-performing teams deploy multiple times per day
- Lead Time for Changes: the time from code commit to live in production. Elite teams measure this in hours, not weeks.
- Change Failure Rate: the percentage of deployments that cause a production incident. High-performing teams keep this below 15%.
- Mean Time to Recovery (MTTR): how long it takes to restore service after a failure. Elite teams recover in under one hour.
DevOps Internship Interview Questions
Landing a DevOps internship in Nepal is competitive. Interviewers know you do not have years of production experience - but they do expect structured thinking, basic technical understanding, and evidence that you have actually tried things on your own.
Concept Understanding Questions
Q1. Why did you choose DevOps?
Do not say "it sounds exciting" or "the salary is good." Give a real answer. Talk about the specific problem DevOps solves - the gap between how software gets built and how it gets delivered. Talk about what drew you to automation, infrastructure, or the engineering side of software delivery. Interviewers remember candidates who show genuine curiosity.
Q2. What does a DevOps engineer actually do day to day?
A DevOps engineer spends most of their time on three things: maintaining and improving CI/CD pipelines, managing infrastructure (often on cloud platforms like AWS), and fixing whatever breaks in the delivery process. They write automation scripts, review deployment processes, work with developers to debug pipeline failures, and set up monitoring so the team knows when something is wrong before users do.
Q3. What is the difference between a developer and a DevOps engineer?
A developer writes application code - features, logic, APIs, databases. A DevOps engineer builds and maintains the infrastructure that runs that code - pipelines, containers, servers, monitoring. In practice, the roles overlap. Good DevOps engineers write clean automation code. Good developers understand how their code will be deployed and operated.
Practical & Portfolio Questions
Q1. Walk me through a CI/CD pipeline you have built or worked with.
If you have built one - even in a training project - walk through every step: what triggers the pipeline, what the stages are, what happens when a test fails, and where the final artifact ends up. Be specific. "I set up a GitHub Actions workflow that runs on every push to main, runs Jest tests, builds a Docker image, and pushes it to Docker Hub" is a strong answer.
Q2. Have you used Docker before? Walk me through how you containerized an app.
Talk through writing a Dockerfile, choosing a base image, copying your app files, installing dependencies, exposing a port, and running the container. If you have used Docker Compose to run a multi-container app locally, mention that too. Our Docker for beginners guide covers this entire process with real examples.
Q3. What DevOps tools have you installed and used in a lab or personal project?
Be honest. List what you have actually used, even if it is just Docker on your laptop or a free-tier AWS account. Interviewers respect honesty far more than a list of tools you have only read about.
Entry-Level DevOps Interview Questions
At the entry level, interviewers expect you to handle real tasks - setting up pipelines, working with Linux, debugging containers. The questions get more specific and more practical.
CI/CD & Automation Questions
Q1. How do you set up a Jenkins pipeline from scratch?
Install Jenkins on a server, install the necessary plugins (Git, Pipeline, Docker), create a new Pipeline job, write a Jenkinsfile that defines your stages (checkout, build, test, deploy), and connect it to your Git repository. Jenkins then triggers the pipeline automatically on every push.
Q2. What happens when a build fails in your CI pipeline?
The pipeline stops at the failed stage and notifies the team - usually via Slack, email, or the CI tool's dashboard. The developer who triggered the build checks the logs, identifies the failure (a failing test, a compilation error, a dependency issue), fixes it, and pushes again. A good team treats a broken build as a top priority - it blocks everyone else from merging.
Q3. How do you trigger a pipeline automatically on a Git push?
Configure a webhook in your Git repository (GitHub, GitLab) that sends an HTTP request to your CI server whenever code is pushed. Jenkins, GitLab CI, and GitHub Actions all support this natively. In GitHub Actions, you define the trigger in the workflow YAML: on: push or on: pull_request.
Linux & Shell Scripting Questions
Q1. How do you check which process is using a specific port?
sudo lsof -i :8080
# or
sudo ss -tulpn | grep 8080
Q2. What is the difference between grep, awk and sed?
- grep: searches for a pattern in text and returns matching lines. Use it to find something.
- awk: processes text by columns and fields. Use it when you need to extract or manipulate structured data.
- sed: stream editor for find-and-replace operations in text. Use it to modify text in place.
Q3. What is a cron job and how do you create one?
A cron job is a scheduled task that runs automatically at a defined time or interval on a Linux server. You create one by editing the crontab:
crontab -eA cron expression like 0 2 * * * runs a task every day at 2:00 AM. The five fields are: minute, hour, day of month, month, day of week.
Docker & Container Questions
Q1. What is the difference between a Docker image and a container?
An image is a read-only blueprint - a snapshot of an application and all its dependencies. A container is a running instance of that image. One image can run many containers simultaneously. The image is the recipe; the container is the cooked dish.
Q2. How do you reduce Docker image size?
- Use a minimal base image: node:18-alpine instead of node:18
- Copy only what the app needs: avoid copying unnecessary files
- Use multi-stage builds: build in one stage, copy only the output into a clean final image
- Clean up package manager caches inside RUN commands: apt-get clean && rm -rf /var/lib/apt/lists/*
Q3. How do you persist data in a Docker container?
Containers are stateless by default - data stored inside a container disappears when the container stops. You persist data using Docker volumes, which store data outside the container on the host machine:
docker run -v mydata:/app/data my-appFor our full guide on how CI/CD connects with Docker in a real workflow, the what is CI/CD blog covers the pipeline from code commit to deployment in detail.
Mid-Level DevOps Interview Questions
At the intermediate level, interviewers expect you to go deeper - architecture decisions, troubleshooting under pressure, and tool-specific technical depth.
Kubernetes Questions
Q1. What is a Pod in Kubernetes?
A Pod is the smallest deployable unit in Kubernetes. It wraps one or more containers that share the same network namespace and storage. In most cases, a Pod contains a single container. Kubernetes schedules and manages Pods across a cluster of nodes.
Q2. What is the difference between a Deployment and a StatefulSet?
- A Deployment manages stateless applications. Pods are interchangeable, any Pod can be replaced with any other. Used for web servers, APIs, and most application workloads.
- A StatefulSet manages stateful applications where each Pod has a stable identity and persistent storage like databases, Kafka brokers, or Zookeeper clusters. Pod names are predictable and stable across restarts.
Q3. How does Kubernetes handle auto-scaling?
Kubernetes has three auto-scaling mechanisms:
- Horizontal Pod Autoscaler (HPA): adds or removes Pod replicas based on CPU or memory usage
- Vertical Pod Autoscaler (VPA): adjusts the CPU and memory requests for existing Pods
- Cluster Autoscaler: adds or removes nodes from the cluster based on pending Pod demand
Scenario: Your Kubernetes pod is in CrashLoopBackOff, what do you do?
CrashLoopBackOff means the container starts, crashes, and Kubernetes keeps restarting it. Step one is checking the logs:
kubectl logs <pod-name> --previous
kubectl describe pod <pod-name>
Common causes: the application is failing on startup due to a missing environment variable, a bad config file, a failed database connection, or an out-of-memory error. Read the logs, find the root cause, fix the underlying issue, and redeploy.
Terraform & IaC Questions
Q1. What is a Terraform state file and why is it critical?
The state file (terraform.tfstate) is Terraform's record of what infrastructure it has created. It maps your configuration to the real resources in the cloud. Without the state file, Terraform cannot know what already exists and would try to create everything from scratch on the next run - potentially creating duplicate resources or destroying existing ones.
In production, the state file lives in a remote backend (like AWS S3 with DynamoDB locking) so it is shared across the team and protected against corruption.
Q2. What is the difference between terraform plan and terraform apply?
- terraform plan: shows you what Terraform will do if you apply. It compares your configuration to the current state and lists resources it will create, change, or destroy. No changes are made.
- terraform apply: actually makes the changes. Always run plan first and review the output before running apply in production.
Q3. How do you handle infrastructure drift in Terraform?
Infrastructure drift happens when someone manually changes a cloud resource outside of Terraform - through the AWS console, for example. Terraform detects drift when you run terraform plan, which shows a difference between the desired state in your config and the actual state of the resource. You fix drift by either updating your Terraform config to match the manual change, or running terraform apply to revert the resource back to the defined state.
Monitoring & Observability Questions
Q1. What is the difference between monitoring and observability?
Monitoring tells you when something is wrong. You set thresholds on known metrics, CPU over 90%, error rate over 5% - and get alerted when those thresholds are crossed.
Observability tells you why something is wrong. A system is observable when you can diagnose any failure, including failures you did not predict using metrics, logs, and traces that the system produces.
You can monitor a system without it being fully observable. But you cannot achieve true observability without good monitoring as a foundation.
Q2. What is Prometheus and how does it work with Grafana?
Prometheus is a monitoring system that scrapes metrics from your applications and infrastructure at regular intervals and stores them in a time-series database. Your applications expose a /metrics endpoint; Prometheus polls that endpoint and stores the data.
Grafana connects to Prometheus as a data source and lets you build dashboards that visualize those metrics - request rates, error rates, latency percentiles, infrastructure utilization. Together, they are the most common open-source monitoring stack in DevOps.
Scenario: Your application response time just spiked, how do you investigate?
Start with your monitoring dashboard. Check whether the spike is in all endpoints or a specific one. Check whether it correlates with a deployment - if a release went out in the last 30 minutes, that is your first suspect. Check database query times, external API latency, and CPU/memory usage on the application servers. Pull the application logs for error messages or slow query warnings during the spike window. Narrow it down step by step: is it the application, the database, the network, or an external dependency?
Senior / Experienced DevOps Interview Questions
Senior interviews shift from "do you know the tool" to "how do you think about the system." Expect architecture discussions, trade-off questions, and scenarios with no single right answer.
Architecture & Strategy Questions
Q1. How do you design a CI/CD pipeline for a microservices application from scratch?
Start with the principles: each service should have its own pipeline, independent deployments, and no hard dependencies between pipeline runs. A typical setup:
Each service has its own repository (or a well-organized monorepo path). Every push triggers: linting, unit tests, Docker image build, container scan, push to registry. On merge to main: integration tests run, image deploys to staging, smoke tests run. On approval: image deploys to production via blue-green or canary strategy. Kubernetes handles the actual deployment; ArgoCD or Flux manages the GitOps sync.
Q2. How do you manage secrets at scale across multiple environments?
Never hardcode secrets in code or Dockerfiles. Use a dedicated secrets manager:
- AWS Secrets Manager or HashiCorp Vault for production secrets
- Kubernetes Secrets (encrypted at rest with KMS) for in-cluster credentials
- Environment-specific secret injection at runtime - the application reads secrets from the environment, not from the codebase
Rotate secrets regularly, restrict access using IAM roles and least-privilege policies, and audit secret access logs.
Q3. How do you ensure security is built into the pipeline? (DevSecOps)
Security cannot be a gate at the end of the pipeline - it needs to run at every stage:
- Code stage: static application security testing (SAST) with tools like SonarQube or Semgrep
- Build stage: dependency scanning for known CVEs with Snyk or OWASP Dependency-Check
- Container stage: image scanning with Trivy or Aqua Security before pushing to the registry
- Deploy stage: infrastructure security checks with tools like Checkov for Terraform and kube-bench for Kubernetes
- Production: runtime security monitoring with Falco to detect suspicious container behavior
Scenario-Based Questions
Q1. Your CI/CD pipeline breaks 10 minutes before a production release, what do you do?
First, stay calm. Check the pipeline logs immediately to identify the exact failure point - is it a test, a build step, or a deployment stage? If it is a flaky test that has failed before, assess whether you can skip it safely with justification and release. If it is a real failure, do not push through. Roll back the release plan, fix the root cause, and reschedule. A 10-minute delay is far better than a broken production deployment at peak traffic.
Q2. A deployment went live and caused an outage, walk me through your incident response.
Immediate priority: restore service. Roll back to the previous version first, investigate second. Run the rollback command, confirm the service is back up, and post a status update to the team and any affected stakeholders.
Then investigate: pull deployment logs and application logs from the outage window, compare what changed between the working and broken versions, identify the root cause. Write a post-mortem - not to assign blame, but to document what happened, what the impact was, what fixed it, and what process changes will prevent it next time.
Q3. How do you handle a disagreement between Dev and Ops teams on a release approach?
Bring both teams to the same data. Dev teams often push for speed; Ops teams push for stability. Neither is wrong - they are optimizing for different risks. The right answer comes from looking at the deployment frequency, error rate, and recovery time together and deciding on a strategy that serves both.
If the disagreement is about a specific release, run a smaller deployment, canary or staged rollout - that lets the Dev team ship while giving Ops team the ability to roll back quickly if metrics degrade.
Questions to Ask the Interviewer
Always prepare 3-4 questions to ask at the end. It shows that you think about the work seriously, not just about getting the job.
- "How often does your team deploy to production?"
- "What does your current CI/CD pipeline look like and what are you actively trying to improve?"
- "What is your biggest infrastructure challenge right now?"
- "How do your Dev and Ops teams collaborate day to day - are they fully integrated or still somewhat separate?"
- "How do you handle incident response and post-mortems?"
These questions also tell you a lot about whether the team operates at a level you want to be part of.
DevOps Interview Preparation Tips
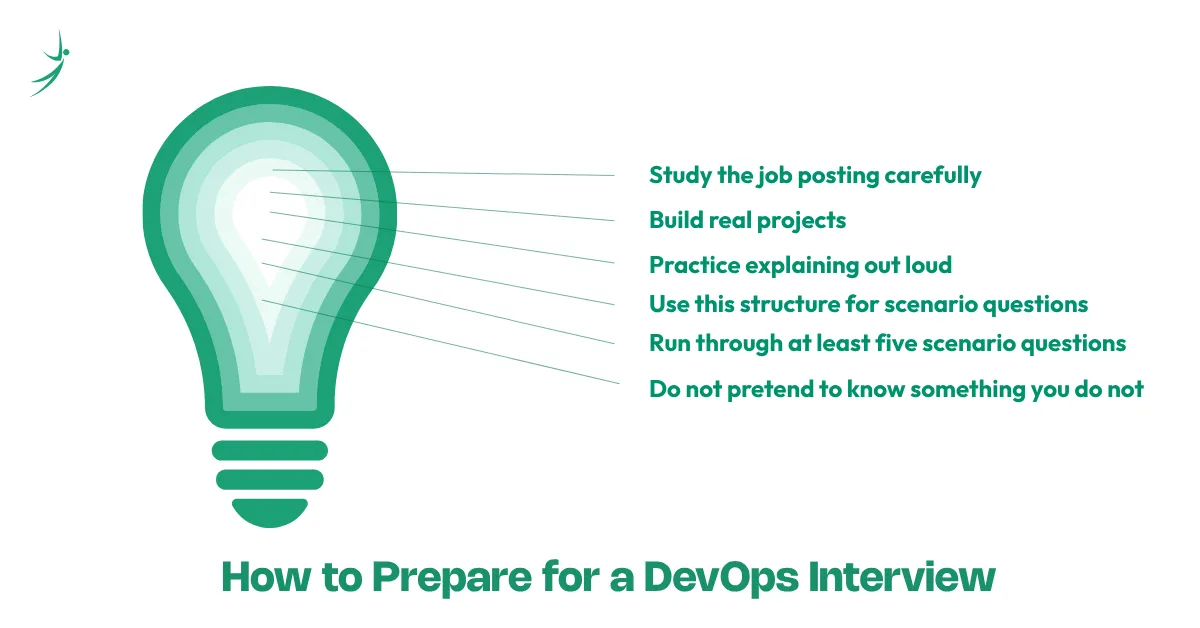
- Study the job posting carefully: Every tool and practice they mention is a potential question. Map your preparation to their stack.
- Build real projects: Employers in Nepal hire based on what you have actually built. A working Jenkins pipeline beats three certifications.
- Practice explaining out loud: DevOps concepts are easy to understand but hard to articulate under pressure. Talk through your answers before the interview, not just in your head.
- Use this structure for scenario questions: Problem → What I did → Outcome. Keep it specific and concise.
- Run through at least five scenario questions before you walk in: The ones in this guide are a good starting point.
- Do not pretend to know something you do not: Interviewers can tell. If you have not used Kubernetes in production, say you have worked with it in a lab environment and explain what you did.
Do's and Don'ts
Do's
- Do talk about real projects, even small ones. A working home lab pipeline is worth more than a list of tools you have read about
- Do admit what you do not know. Following up with "but here is how I would figure it out" shows problem-solving instinct
- Do ask questions about the team's current setup. It shows genuine interest and strategic thinking
- Do practice your answers out loud before the interview, not just in your head
- Do connect your technical answers to outcomes; speed, reliability, cost, or team efficiency
- Do research the company's tech stack and tailor your examples to what they actually use
Don'ts
- Don't memorize definitions and recite them. Interviewers always follow up with "can you give me an example?" If you cannot, the definition means nothing
- Don't exaggerate your experience. Saying you have "worked extensively with Kubernetes" when you ran a tutorial once will come apart the moment they ask a follow-up question
- Don't badmouth your previous team or employer. Even if the experience was bad, frame it as a learning opportunity
- Don't give one-word answers to scenario questions. Walk the interviewer through your thinking step by step
- Don't skip the questions-to-ask section. Saying "I don't have any questions" signals low interest every time
- Don't apply for roles where you meet zero of the requirements. But do apply when you meet 60-70%, DevOps hiring managers in Nepal hire for potential and attitude alongside current skill
Final Thoughts
DevOps interviews reward people who understand why the tools exist, not just what they do. Every question in this guide - from the basics to the senior scenarios - comes back to that same idea: can you think clearly about software delivery problems and solve them with the right combination of culture, automation, and tooling?
Prepare with real projects. Practice talking through your work. And walk in knowing that the best answer is always an honest one backed by something you have actually built.
Want to build job-ready DevOps skills with real pipelines and hands-on cloud projects? Explore Skill Shikshya's DevOps and Cloud diploma program, built around what Nepal's IT industry is actually hiring for right now.
Frequently Asked Questions
What topics are covered in a DevOps interview?
How do I prepare for a DevOps interview as a fresher?
What is the most commonly asked DevOps interview question?
Do DevOps interviews include coding or scripting questions?
How long does it take to prepare for a DevOps interview?
What salary can I expect after clearing a DevOps interview in Nepal?
About Author: