What Is Predictive Analytics? Complete Guide with Python, Tools, Dashboards & Career Path in Nepal (2026)
Every business has a question it can't fully answer with last month's report: "What's going to happen next?" That's the question predictive analysis is built to answer. Not guessing predicting- using patterns baked into historical data, statistical models, and increasingly, machine learning to give organizations a calculated, evidence-based view of the future before it arrives.
This guide covers what is predictive analysis from first principles, walks through every major technique, shows you exactly how to do predictive analysis using both Python and R, covers the leading predictive analytics platforms and predictive analysis software, and explains how predictive analytics fits into a data analyst roadmap and a real career as a data analyst in nepal.
If you haven't yet read what is data analytics as a broader discipline, or where data analytics vs data science diverge as career paths, those are the right context-setters before going deep on predictive work specifically.
What Is Predictive Analysis? (Definition & Meaning)
Predictive analysis is the branch of data analytics that uses historical data, statistical algorithms, and machine learning techniques to forecast future outcomes, behaviors, and events with a calculated probability.
Put another way: descriptive analytics tells you what happened, diagnostic analytics tells you why it happened, and predictive analytics tells you what's likely to happen next and how confident you should be in that forecast.
Predictive analytics meaning in a business context: it's the discipline of building models that learn from the past to make predictions about the future, enabling organizations to act before a problem occurs or an opportunity passes. A bank that predicts which loan applicants are likely to default. A telecom company that predicts which customers are about to cancel their subscription. A hospital that predicts which patients are at risk of readmission. These are all predictive analytics at work.
Data analytics meaning more broadly: the full discipline of examining data to support decisions, with predictive analytics sitting at the advanced end of the maturity spectrum.
The Four Types of Analytics: Where Predictive Analysis Fits
Before going deeper into predictive analysis of data, it's worth understanding the four-stage analytics maturity model that frames every serious data analytics description you'll find in the industry:
| Stage | Question It Answers | Example | Tools Used |
|---|---|---|---|
| Descriptive Analytics | What happened? | "Revenue was NPR 12M last quarter." | Excel, Power BI, SQL |
| Diagnostic Analytics | Why did it happen? | "Revenue dropped because of 18% churn in the West district." | SQL, Excel, Tableau |
| Predictive Analytics | What will happen? | "Based on current churn signals, 23% of West customers are likely to cancel next month." | Python, R, ML models, predictive analytics platforms |
| Prescriptive Analytics | What should we do? | "Offer a 20% discount to the at-risk segment model shows 65% retention probability." | AI/ML, optimization engines |
Most organizations in Nepal's data analytics market are still primarily at the descriptive and diagnostic stages. Building predictive capability the ability to answer "what will happen" with statistical confidence is what separates a standard analyst from a data analytics specialist and commands the corresponding salary premium.
How to Do Predictive Analysis: The Step-by-Step Process
How to do predictive analysis follows a structured workflow regardless of the industry, tool, or specific model type. This is the data analytics process as applied to prediction:
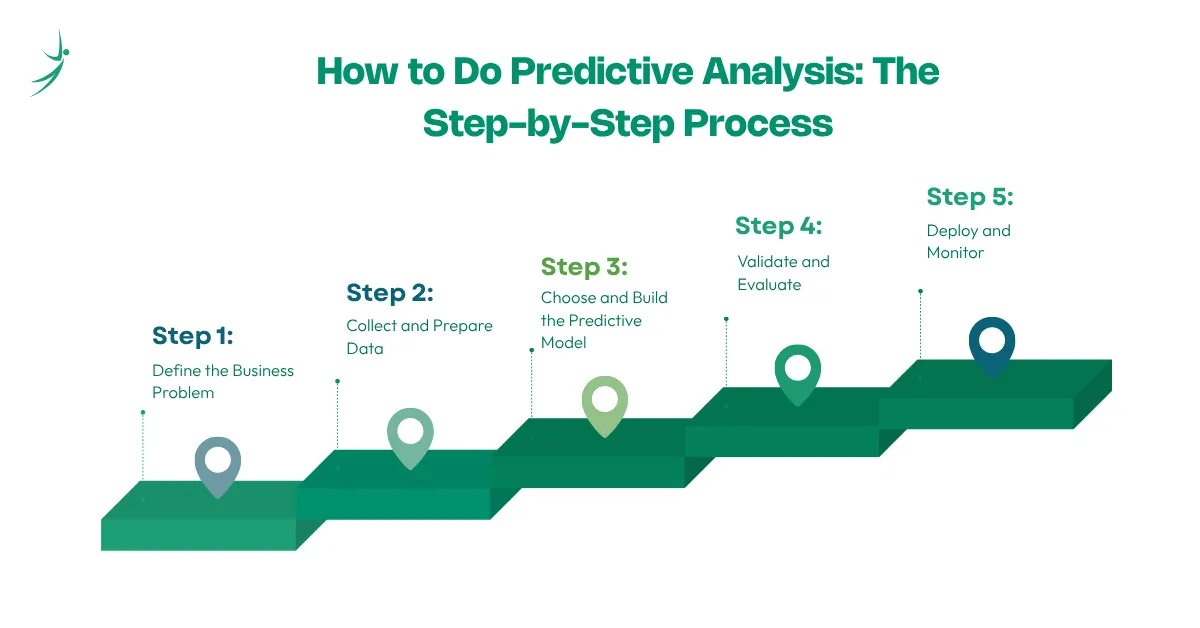
Step 1: Define the Business Problem
Predictive models only work if you're answering a specific, well-defined question. Vague questions produce useless models. Good predictive problem statements:
- "Which customers are likely to churn in the next 30 days?" (binary classification)
- "What will our monthly sales be next quarter?" (regression/time series)
- "Which transactions are fraudulent?" (anomaly detection/classification)
- "Which job candidates are most likely to succeed in this role?" (predictive analytics hr use case)
Step 2: Collect and Prepare Data
Predictive analysis of data begins with gathering all relevant historical data: transaction records, customer behavior logs, HR records, financial statements, sensor readings, or whatever domain-specific data relates to the prediction target.
Data preparation (typically 60–80% of total project time) includes:
- Handling missing values (imputation, removal, flagging)
- Encoding categorical variables (one-hot encoding, label encoding)
- Feature scaling (normalization, standardization)
- Removing duplicate records and correcting anomalies
Feature engineering creating new meaningful variables from raw data (e.g., "days since last purchase" from a transaction date)
Step 3: Choose and Build the Predictive Model
Select the appropriate model type based on the problem structure (classification, regression, time series, or clustering see techniques section below). Train the model on a historical dataset split into training (typically 70–80%) and test (20–30%) subsets.
Step 4: Validate and Evaluate
A model that performs well on its training data but poorly on new data is overfit — it has memorized patterns rather than learned them. Evaluation metrics:
- Classification models: Accuracy, Precision, Recall, F1 Score, AUC-ROC
- Regression models: MAE (Mean Absolute Error), RMSE (Root Mean Square Error), R²
- Time series models: MAPE (Mean Absolute Percentage Error), RMSE
Step 5: Deploy and Monitor
A predictive model that lives only in a Jupyter notebook delivers zero business value. Deployment means integrating the model output into a predictive analysis dashboard, a business process, an automated alert system, or an API that other systems can query. Monitoring means tracking model accuracy over time; models degrade as the world changes, a phenomenon called "model drift."
Predictive Analysis Techniques: The Core Model Types
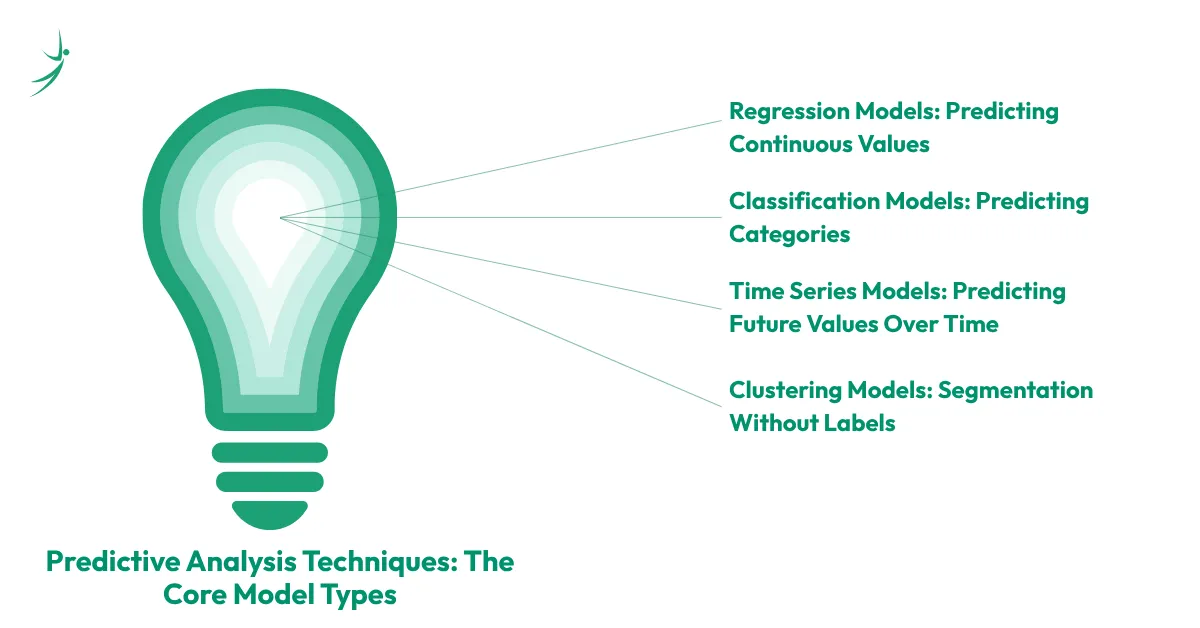
1. Regression Models: Predicting Continuous Values
Regression predicts a numerical output. The most fundamental predictive analysis in machine learning is the starting point.
- Linear Regression: Predicts a continuous value based on one or more input variables. Example: predicting monthly revenue based on marketing spend, season, and number of active customers.
- Multiple Regression: Extends linear regression to multiple predictors simultaneously.
- Polynomial Regression: Captures non-linear relationships between variables.
2. Classification Models: Predicting Categories
Classification predicts which category a new data point belongs to.
- Logistic Regression: Despite the name, it is used for binary classification (yes/no, churn/stay, fraud/legitimate). The most widely used baseline classification model.
- Decision Trees: Create a tree of if/then rules from the data. Highly interpretable — you can explain exactly why the model made a specific prediction.
- Random Forest: An ensemble of decision trees that votes collectively, dramatically improving accuracy over a single tree.
- Gradient Boosting (XGBoost, LightGBM): The dominant approach for tabular data classification in 2026; consistently top-performing in real business predictive analytics projects.
- Support Vector Machines (SVM): Effective for smaller, high-dimensional datasets.
3. Time Series Models: Predicting Future Values Over Time
Time series models specifically handle data that has a temporal dimension daily sales, monthly users, weekly transactions where the sequence and timing of data points matter.
ARIMA (Autoregressive Integrated Moving Average): The classic statistical time series model, excellent for stationary data with no complex seasonality.
- SARIMA: Extends ARIMA with seasonal components.
- Exponential Smoothing (ETS): Gives more weight to recent observations, good for short-term business forecasting.
- Prophet (by Meta): Designed for business time series with strong seasonality and holiday effects; extremely beginner-accessible.
- LSTM (Long Short-Term Memory neural networks): Deep learning approach to time series, best for complex patterns in large datasets.
4. Clustering Models: Segmentation Without Labels
Clustering is unsupervised prediction grouping data points by similarity without pre-defined categories. Used for customer segmentation, anomaly detection, and exploratory market analysis.
- K-Means Clustering: Assigns each point to the nearest of K centroids; fast, scalable, widely used.
- Hierarchical Clustering: Builds a tree of cluster relationships; useful when the number of clusters isn't known in advance.
- DBSCAN: Density-based clustering, excellent for detecting anomalies and irregular-shaped clusters.
Predictive Analysis Using Python: Code Examples
Predictive analysis in Python is the dominant approach in professional and academic predictive work globally. Python's ecosystem pandas, scikit-learn, statsmodels, Prophet, XGBoost— provides everything needed for end-to-end predictive modeling.
Example 1: Customer Churn Prediction with scikit-learn
import pandas as pd
from sklearn.model_selection import train_test_split
from sklearn.ensemble import RandomForestClassifier
from sklearn.metrics import classification_report, roc_auc_score
from sklearn.preprocessing import LabelEncoder

# Load customer data
df = pd.read_csv('customer_data.csv')

# Feature engineering
df['days_since_last_purchase'] = (pd.Timestamp.today() - pd.to_datetime(df['last_purchase_date'])).dt.days
df['avg_monthly_spend'] = df['total_spend'] / df['months_active']

# Encode categorical columns
le = LabelEncoder()
df['region_encoded'] = le.fit_transform(df['region'])

# Define features and target
features = ['days_since_last_purchase', 'avg_monthly_spend', 'total_orders',
            'support_tickets', 'region_encoded', 'months_active']
X = df[features]
y = df['churned']  # 1 = churned, 0 = retained

# Train-test split
X_train, X_test, y_train, y_test = train_test_split(
    X, y, test_size=0.2, random_state=42, stratify=y
)

# Train Random Forest model
model = RandomForestClassifier(n_estimators=200, max_depth=8, random_state=42)
model.fit(X_train, y_train)

# Evaluate
y_pred = model.predict(X_test)
y_prob = model.predict_proba(X_test)[:, 1]
print(classification_report(y_test, y_pred))
print(f"AUC-ROC Score: {roc_auc_score(y_test, y_prob):.4f}")

# Feature importance — understanding what drives churn
importance_df = pd.DataFrame({
    'feature': features,
    'importance': model.feature_importances_
}).sort_values('importance', ascending=False)
print(importance_df)
Example 2: Sales Forecasting with Prophet
from prophet import Prophet
import pandas as pd
import matplotlib.pyplot as plt

# Prepare data (Prophet requires columns named 'ds' and 'y')
df = pd.read_csv('monthly_sales.csv')
df_prophet = df.rename(columns={'month': 'ds', 'revenue': 'y'})
df_prophet['ds'] = pd.to_datetime(df_prophet['ds'])

# Initialize and fit model
model = Prophet(
    yearly_seasonality=True,
    weekly_seasonality=False,
    changepoint_prior_scale=0.05  # controls trend flexibility
)
model.add_country_holidays(country_name='NP')  # Nepal holidays
model.fit(df_prophet)

# Create future dataframe for 12-month forecast
future = model.make_future_dataframe(periods=12, freq='M')
forecast = model.predict(future)

# Plot forecast
fig = model.plot(forecast)
plt.title('12-Month Revenue Forecast — Nepal Market')
plt.xlabel('Month')
plt.ylabel('Revenue (NPR)')
plt.tight_layout()
plt.savefig('sales_forecast.png', dpi=150)

# Extract forecast values
print(forecast[['ds', 'yhat', 'yhat_lower', 'yhat_upper']].tail(12))
The yhat_lower and yhat_upper columns give confidence intervals telling you not just what revenue is predicted to be, but how confident the model is in that range. This is what makes a predictive analysis dashboard useful for business stakeholders: not a single number, but a range with a confidence level attached.
Predictive Analysis Using R
Predictive analysis using r is still dominant in academic research, biostatistics, and econometrics, and is widely used in healthcare and social science analytics. For business-oriented roles in Nepal's market, Python is more in demand, but R is worth knowing for academic postgraduate work and NGO/research analyst roles.
Key R packages for predictive analytics:
- caret the classic unified interface for training and comparing classification/regression models in R
- tidymodels the modern, tidyverse-aligned framework replacing caret
- forecast the standard library for time series (ARIMA, ETS, TBATS)
- randomForest and xgboost available in R as well as Python
- glm() base R's logistic regression function, with no package needed
A simple logistic regression for churn prediction in R:
library(tidymodels)
library(readr)

# Load data
df <- read_csv("customer_data.csv")

# Split data
set.seed(42)
split <- initial_split(df, prop = 0.8, strata = churned)
train_data <- training(split)
test_data  <- testing(split)

# Define and fit logistic regression
churn_model <- logistic_reg() %>%
  set_engine("glm") %>%
  set_mode("classification") %>%
  fit(churned ~ days_since_last_purchase + avg_monthly_spend +
        total_orders + support_tickets, data = train_data)

# Evaluate
predictions <- predict(churn_model, test_data, type = "prob")
results <- bind_cols(test_data, predictions)
roc_auc(results, truth = churned, .pred_1)
Predictive Analytics Platforms and Software (2026 Overview)
The predictive analytics platforms and predictive analysis software market spans a wide range, from open-source Python/R libraries used by data scientists to no-code enterprise platforms used by business analysts. Key options:
| Platform | Type | Best For | Pricing |
|---|---|---|---|
| Python (scikit-learn, XGBoost, Prophet) | Open-source library | Data scientists building custom models | Free |
| R (tidymodels, forecast) | Open-source language | Academic, research, statistical analysis | Free |
| Microsoft Azure Machine Learning | Cloud ML platform | Enterprise teams scaling Python/R models | Pay-per-use |
| Google Vertex AI | Cloud ML platform | Google ecosystem integration, AutoML | Pay-per-use |
| AWS SageMaker | Cloud ML platform | AWS-native organizations | Pay-per-use |
| IBM Watson Studio | Enterprise platform | Governed, auditable predictive models | Enterprise pricing |
| SAS Analytics | Enterprise software | Banking, insurance, regulated industries | Enterprise pricing |
| DataRobot | AutoML platform | Business analysts without coding background | Enterprise pricing |
| Tableau Pulse / Einstein AI | BI-embedded prediction | Embedded predictive alerts in dashboards | Included in Salesforce plans |
| Power BI + Azure ML | BI-embedded prediction | Microsoft ecosystem, Power BI dashboards | Azure ML + Power BI Pro |
| KNIME | Open-source workflow tool | No-code/low-code visual predictive pipelines | Free (open-source edition) |
For data analyst in nepal roles beginning their predictive analytics journey, the practical stack is: Python (scikit-learn + XGBoost + Prophet) for model building, plus Power BI or Tableau for deploying model outputs into a predictive analysis dashboard stakeholders can monitor.
Predictive Analysis Dashboard: Making Models Accessible
A predictive analysis dashboard is the interface that translates model outputs prediction scores, probability estimates, forecast ranges into something business stakeholders can monitor, filter, and act on without needing to understand the underlying model.
- A well-built predictive dashboard for a bank in Nepal might show:
- A heatmap of loan default risk scores by branch and loan type (color-coded: red = high risk, green = low risk)
- A 3-month rolling forecast of new loan applications by district with confidence intervals
- A customer churn risk ranking showing the 50 highest-risk clients with their key risk factors
- A model performance tracker showing how accurate last month's predictions were compared to actual outcomes
Building this in Power BI involves: publishing the Python model's output as a CSV or database table, connecting Power BI to that table, and building the visualization layer on top. Our Power BI for beginners guide covers the dashboard-building mechanics in full.
In Tableau, the Tableau Pulse feature now delivers predictive alerts automatically the model's output appears as natural language summaries pushed to stakeholders via email or Slack, with the supporting data analytics dashboard available for deeper exploration.
Predictive Analytics AI: The 2026 Landscape
Predictive analytics ai is no longer a future concept it's the current standard in enterprise analytics. Here's what ai ml in data analytics looks like in predictive contexts in 2026:
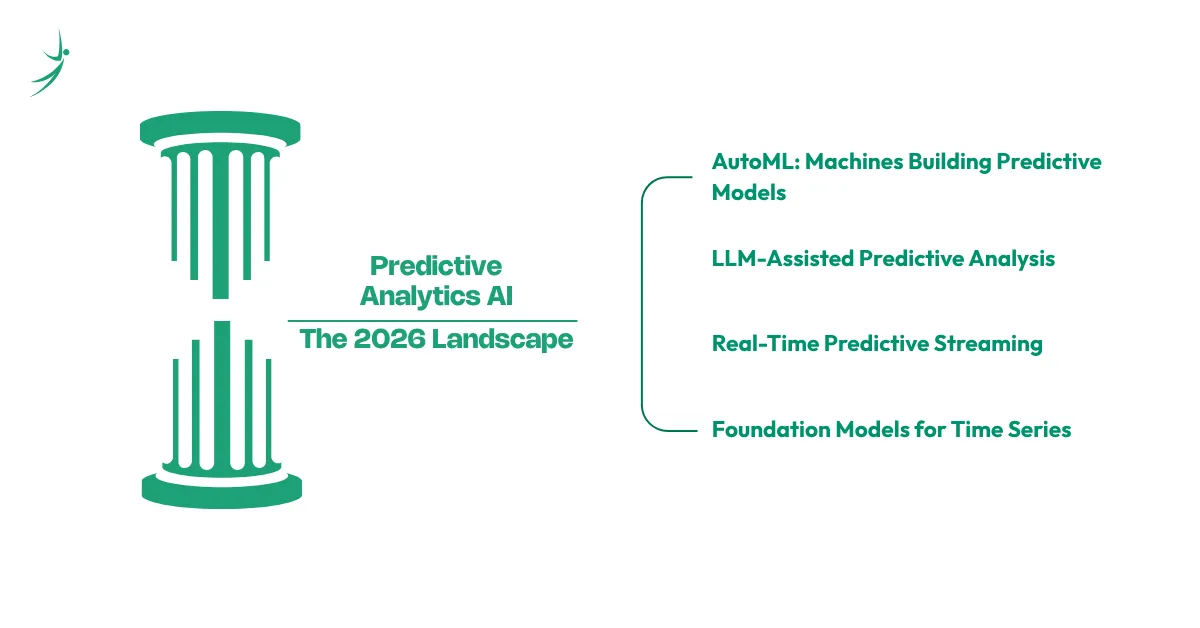
AutoML: Machines Building Predictive Models
Platforms like DataRobot, Google AutoML, and Azure AutoML can automatically test dozens of model types, tune hyperparameters, and select the best-performing model with minimal human input. This doesn't eliminate the need for data scientists you still need to define the problem, prepare the data, and interpret results but it dramatically accelerates the experimentation cycle.
LLM-Assisted Predictive Analysis
Large language models (GPT-4o, Claude, Gemini) are increasingly integrated into ai data science machine learning workflows as analytical assistants: writing data preparation code from natural language descriptions, explaining model outputs in plain English for non-technical stakeholders, and flagging potential issues in datasets before model training.
Real-Time Predictive Streaming
Traditional predictive models batch-process data on a schedule (daily, weekly). Modern predictive analytics ai systems run on streaming data pipelines (Apache Kafka, AWS Kinesis) to score predictions in real time — fraud detected at transaction time, not discovered in last night's batch run.
Foundation Models for Time Series
Specialized large models trained on trillions of time series observations (including Meta's Chronos, Google's TimesFM, and Amazon's Chronos-T5) are reducing the effort required to build accurate forecasting models from weeks of custom feature engineering to hours of prompt configuration. These are the ai data science subjects becoming standard at the frontier of predictive analytics in 2026.
For the broader context of how AI is reshaping the analyst's role what new skills are required, which tasks are being automated, and how to position yourself our AI in data analytics guide covers this transformation in full.
Predictive Analysis for Business: Real-World Use Cases
Predictive Analytics HR
Predictive analytics hr is one of the fastest-growing enterprise use cases globally, and one starting to appear in Nepali organizations with 500+ employees:
- Employee attrition prediction: identifying which high-performing employees are likely to resign in the next 90 days based on engagement scores, salary benchmarking, manager feedback patterns, and time-since-last-promotion
- Candidate success prediction: predicting which applicants from a hiring pool are most likely to exceed performance expectations in the role
- Training ROI modeling: predicting which employees will benefit most from specific learning interventions based on past training response data
- Workforce demand: forecasting predicts how many employees in which roles will be needed six months from now based on business growth models
Finance and Banking (Nepal Context)
- Nepali banks and microfinance institutions are active adopters of predictive analytics:
- Credit scoring models for loan default probability (a significant regulatory priority in Nepal's banking sector)
- Digital transaction fraud detection using classification models on payment gateway data
- Deposit and withdrawal volume forecasting for liquidity management
- NPL (Non-Performing Loan) early warning systems
Retail and E-commerce
- Customer lifetime value (CLV) prediction to focus retention spending on highest-value customers
- Demand forecasting and inventory optimization to reduce stockouts and dead stock
- Price elasticity modeling predicting how demand changes with price adjustments
Healthcare (NGO and Health Sector in Nepal)
- Disease outbreak risk modeling (malaria, dengue, respiratory infections) by district and season
- Patient readmission risk prediction for hospital discharge planning
- Drug and supply demand forecasting for health post inventory across remote districts
Predictive Analysis Big Data: Scale and Infrastructure
Predictive analysis big data refers to predictive modeling on datasets that are too large for a single machine or conventional in-memory processing — typically hundreds of millions of rows or datasets with complex real-time streaming requirements.
The key tools in big data predictive analytics:
- Apache Spark with PySpark MLlib: distributed machine learning that runs across clusters of machines; the standard for large-scale model training
- Hadoop ecosystem: HDFS for storage, Hive for SQL-like querying, Pig for data transformation
- Google BigQuery M: Runs SQL-syntax machine learning directly on BigQuery data at petabyte scale
- Databricks: Managed Spark platform with built-in MLflow for experiment tracking and model management
- Apache Kafka + Spark Streaming: Real-time predictive scoring on incoming data streams
For most data analyst in nepal roles and business contexts, conventional Python on a standard laptop handles 90% of real-world predictive projects. Big data infrastructure becomes relevant when you're joining organizations with genuinely large-scale data operations — major banks, telecom companies, or international platforms.
Predictive Analytics World: The Global Industry Landscape
The predictive analytics world is one of the fastest-growing segments of enterprise software. The global predictive analytics market was valued at approximately USD 12.5 billion in 2024 and is projected to exceed USD 38 billion by 2030, driven by AI adoption, cloud data infrastructure, and expanding use cases across every industry sector.
In Nepal specifically:
- Banking and financial services is the most advanced adopter, with several commercial banks running credit scoring and fraud detection models in production
- Telecom companies (Ncell, Nepal Telecom) use predictive churn and ARPU models
- NGOs and development organizations use donor data and program monitoring data for impact prediction and budget allocation forecasting
- IT and software companies are building predictive features into their products for both domestic and international clients
This growing data analytics business need is one of the primary forces driving demand for structured data analytics courses in nepal that include predictive analytics as a component not as an elective, but as a core output skill.
Data Analytics Roadmap: Where Predictive Analytics Fits
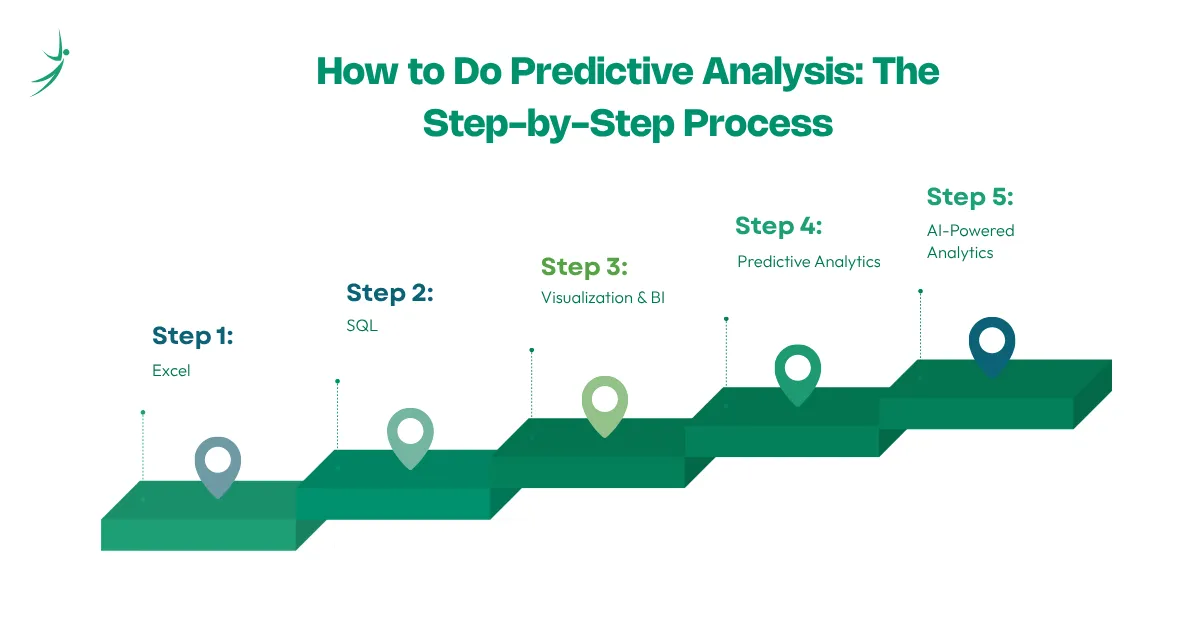
Predictive analytics is Stage 4 in the full data analyst roadmap for Nepal-based analysts:
- Stage 1 — Excel (Excel for data analytics): Data cleaning, PivotTables, basic statistical functions. The foundation every analyst starts on.
- Stage 2 — SQL (SQL for data analytics): Querying databases, joining tables, aggregating large datasets. Non-negotiable before predictive work.
- Stage 3 — Visualization & BI (Power BI for beginners or Tableau for beginners): Building dashboards that communicate findings. Also where predictive model outputs get surfaced to stakeholders
- Stage 4 — Predictive Analytics: This post covers this stage Python (scikit-learn, XGBoost, Prophet) for model building. Statistics for understanding and evaluating models. Feature engineering for improving model performance.
- Stage 5 — AI-Powered Analytics: LLM-assisted analysis, AutoML platforms, real-time streaming analytics, and foundation models for time series. The frontier — where ai data science subjects and ai data science machine learning skills differentiate senior analysts from mid-level ones.
Data Analytics Required Skills for Predictive Analytics Roles
When employers list data analytics required skills for roles with predictive analytics responsibility, they typically screen for:
| Skill | Level Required | Why |
|---|---|---|
| Python (pandas, scikit-learn) | Intermediate-Advanced | Core tool for model building |
| SQL | Intermediate | Extracting and preparing training data |
| Statistics (probability, regression, hypothesis testing) | Solid foundation | Understanding what models are doing and why |
| Feature engineering | Intermediate | The biggest lever on model performance |
| Model evaluation | Intermediate | Knowing when a model is good enough — and when it isn't |
| Data visualization / dashboarding | Foundational | Communicating model outputs to non-technical stakeholders |
| Business domain knowledge | Moderate | Choosing models that match the actual business context |
| Communication | Strong | Explaining probabilistic predictions to decision-makers who think in certainties |
Data Analytics Salary in Nepal: Predictive Analytics Premium
Salary ranges for analytics roles with predictive modeling responsibility, cross-referenced from Kumarijob, NecoJobs, Paylab Nepal, and live job postings (mid-2026):
| Role | Experience | Monthly Salary (NPR) |
|---|---|---|
| Data Analytics Intern | 0 years | 10,000–25,000 |
| Junior Data Analyst (descriptive/SQL focus) | 0–1 years | 30,000–60,000 |
| Mid-level Data Analyst (BI + SQL + some Python) | 1–3 years | 60,000–100,000 |
| Senior Data Analyst (predictive modeling + Python) | 3–5 years | 100,000–150,000 |
| AI Data Analyst Salary (predictive + AI/ML integration) | 3+ years | 120,000–200,000+ |
| Data Science / ML Engineer (production models) | 4+ years | 150,000–250,000+ |
The salary jump from a mid-level analyst (NPR 60,000–100,000) to a senior analyst or data scientist doing predictive work (NPR 120,000–200,000+) is the largest single step in the analytics career ladder and it's specifically gated on Python proficiency and the ability to build, validate, and deploy a real predictive model.
For data analytics remote jobs: roles explicitly requiring predictive analytics and Python/ML skills are among the most accessible for Nepali analysts in international markets, paying USD 1,500–4,000/month for strong candidates with portfolio evidence of real predictive projects.
Data Analytics Projects: Build Your Predictive Analytics Portfolio
Real data analytics project examples that demonstrate predictive skills to employers:
Beginner predictive projects:
- Customer churn prediction using the Telco Customer Churn dataset (Kaggle) binary classification with logistic regression and random forest, deployed to a simple Power BI dashboard showing churn risk by customer segment
- House price prediction using Nepal real estate listing data, linear regression with feature engineering on location, size, and amenity variables
Intermediate projects:
- Loan default prediction using Nepal microfinance public data gradient boosting model with feature importance analysis and model performance report
- Sales forecasting for a retail dataset using Prophet 12-month forecast with confidence intervals, visualized in Tableau
Advanced projects:
- End-to-end MLOps pipeline: data ingestion → feature engineering → model training → model registry → prediction API → Power BI dashboard consuming predictions via API
- HR attrition prediction dashboard: Python model output connected live to a Tableau predictive analytics dashboard, with model refresh on monthly HR data updates
Data Analytics Courses in Nepal: Learning Predictive Analytics
Whether you're searching for data analytics free courses that cover predictive basics, or a structured data analytics full course that takes you from Excel to Python models, the key question to ask is: does the curriculum include actual model-building with real datasets, or just theory?
Data analytics best courses for predictive analytics (free):
- Coursera — Machine Learning Specialization by Andrew Ng (Stanford): Free to audit; the gold-standard introduction to the theory behind prediction
- Google's Advanced Data Analytics Certificate (Coursera): Free to audit; covers Python and regression models in applied business contexts
- Kaggle's free ML courses: Hands-on, free, project-based; covers pandas, scikit-learn, and XGBoost from scratch
Where structured data analytics training adds what free courses can't replicate: mentor feedback on your actual model's logic, Nepal-specific business case studies, end-to-end project builds from problem definition through dashboard deployment, and a cohort of peers doing the same work simultaneously.
Skill Shikshya's Business Data Analytics with AI course includes predictive analytics as part of the advanced AI-integrated analytics curriculum covering Python for data analysis, basic ML model building, and connecting model outputs to Power BI dashboards, within the broader stack of Excel → SQL → Power BI → Python → AI tools taught in sequence.
Our full career guide to becoming a data analyst maps the complete path from beginner to predictive analytics practitioner, including which data analytics courses online build toward this level.
Frequently Asked Questions
What is predictive analysis?
What is predictive analytics meaning in business?
How is predictive analysis different from data analytics?
What tools are used for predictive analytics?
What is predictive analytics in HR?
What is the data analytics salary for predictive analytics roles in Nepal?
How long does it take to learn predictive analytics?
About Author:

Dhiraj Bashyal is a Machine Learning Engineer at Vrit Technologies, with 3 years of hands-on experience in applied AI and machine learning. He brings that industry experience directly into the classroom, teaching Data Science and Machine Learning at Skill Shikshya, where he helps learners build a practical, project-ready foundation in Python, ML workflows, and real-world data problem-solving.