Business Data Analytics With AI Roadmap 2026 in Nepal | From Beginner to Expert
Three years ago, I was sitting in a Kathmandu café, frustrated with my career plateau. I had a business degree, decent Excel skills, and absolutely no idea that data analytics would completely change my professional trajectory. Fast forward to today, I'm leading analytics projects for multiple companies, building predictive models that drive real business decisions, and earning significantly more than I ever thought possible in Nepal.
The business data analytics field in Nepal is exploding right now. Companies across Kathmandu, Pokhara, and beyond are desperately searching for professionals who can turn data into insights. But here's the problem: most people don't know where to start, and many training programs teach outdated skills that won't matter in 2026.
I'm writing this roadmap because I wish someone had given me this exact blueprint when I started. This isn't theory or fluff. This is the actual path I followed, the mistakes I made, and the shortcuts I discovered.
What is Business Data Analytics With AI (And Why Nepal Needs It)
Let me break this down simply. Business data analytics is the process of examining company data, customer behavior, sales patterns, and operational metrics to make smarter business decisions. When you add AI into the mix, you're essentially giving yourself superpowers to predict future trends, automate repetitive analysis, and uncover insights humans might miss.
Think about it: Every Nepali business generates data. Your local café tracks daily sales. Banks process thousands of transactions. E-commerce platforms monitor customer behavior. Telecom companies analyze network usage. But most of this data sits unused because nobody knows how to extract value from it.
That's where you come in.
In Nepal specifically, I've seen the demand surge in these sectors:
- Banking and Financial Services: Risk assessment, fraud detection, customer segmentation
- Telecommunications: Network optimization, customer churn prediction
- E-commerce: Sales forecasting, recommendation systems
- Healthcare: Patient data analysis, operational efficiency
- Tourism:Demand prediction, pricing optimization
Salary-wise? Entry-level data analysts in Kathmandu start around NPR 40,000-60,000. With 2-3 years of experience and AI skills, you're looking at NPR 100,000-150,000. Senior positions and consulting work can push this to NPR 200,000+.
If you want structured, hands-on training to fast-track this journey, consider enrolling in a comprehensive business analytics program that covers the entire roadmap from foundations to AI integration.
The market is hungry. The question is: Are you ready to feed it?
Why Today's Generation Has the Perfect Opportunity for Data Analytics in Nepal
Let me be clear: 2026 is the golden age for aspiring data analysts in Nepal. The timing couldn't be better, and here's why:
Nepal's Digital Infrastructure is Finally Ready
For the first time in our country's history, we have the infrastructure to support a thriving data analytics industry. According to the Nepal Telecommunications Authority, internet penetration has crossed 80% in urban areas, with 4G coverage expanding rapidly. The Government of Nepal's Digital Nepal Framework is pushing for digital transformation across all sectors – from agriculture to healthcare.
What does this mean for you? Every digitizing business needs data professionals. Banks are moving to digital platforms. Retailers are building e-commerce systems. Even local businesses are generating digital footprints through social media and payment apps like eSewa and Khalti.
The Skills Gap is Massive (And That's Your Opportunity)
The World Economic Forum’s Future of Jobs Report projects data analysts and scientists as among the fastest-growing roles globally through 2027. In Nepal, hiring managers frequently report difficulty finding candidates with strong, hands-on data analytics and AI skills, despite a growing number of applicants.
This gap is your opportunity. While universities are still updating curricula, forward-thinking individuals who upskill now will have a 3-5 year head start in the market.
AI Tools Have Democratized Analytics
Here's something previous generations didn't have: AI-powered tools that accelerate learning and productivity by 10x. GitHub Copilot helps you write code faster. ChatGPT explains complex statistical concepts in simple terms. Google Cloud AutoML lets you build models without being a PhD-level expert.
According to McKinsey's research on AI adoption, professionals using AI tools are 40% more productive than those who don't. You're not competing with the previous generation's skill requirements – you're operating in an era where AI amplifies your capabilities.
Quality Training is Now Accessible in Nepal
Gone are the days when you had to go abroad or pay lakhs for quality data analytics training. Today, Nepal has institutes providing world-class, practical training that's aligned with global industry standards.
Skill Shikshya (best IT institute in Nepal) stands out as one of the few institutes in Nepal offering a comprehensive business analytics with AI program that:
- Covers the complete roadmap from Python basics to advanced machine learning
- Focuses on real business projects, not just theoretical exercises
- Provides hands-on training with industry-standard tools (Python, SQL, Power BI, Cloud platforms)
- Offers placement support with partnerships across Nepal's IT sector
- Features instructors with actual industry experience, not just academic backgrounds
- Includes AI-powered analytics tools training – the competitive edge for 2026
Unlike traditional computer science degrees that teach outdated curricula, Skill Shikshya's program is updated quarterly based on market demand. They understand that businesses need analysts who can deliver results from day one, not spend six months learning on the job.
I've personally reviewed their curriculum and spoken with their graduates. The feedback is consistent: practical, job-ready skills taught by people who actually work in the field. Several of my current team members are Skill Shikshya alumni, and they've hit the ground running.
The Remote Work Revolution
Industry reports and surveys on the state of work show that a large majority of companies continue to offer remote or hybrid work options, reflecting ongoing flexibility in workplace structures. For example, by early 2025, approximately 80% of employees whose jobs can be done remotely were working in hybrid or fully remote arrangements.
For data analysts in Nepal, this means:
- Access to international salaries (USD $20-50/hour freelance rates)
- Work for US/European companies from Kathmandu
- Build a global portfolio while living in Nepal
- Flexibility to balance work with personal commitments
The Bottom Line for Today's Generation
If you're reading this in 2026, you have advantages previous generations could only dream of:
- Infrastructure: Fast internet, cloud platforms, collaborative tools
- Resources: Free learning materials, AI assistants, global communities
- Opportunities: Remote work, freelancing, international clients
- Training: Quality institutes like Skill Shikshya offering practical, affordable programs
- Timing: Massive skills gap with companies desperate to hire
The question isn't whether you should pursue data analytics. The question is: will you seize this once-in-a-generation opportunity?
The Complete Business Data Analytics With AI Roadmap
Phase 1 - Foundation Building (Months 1-3)
I'll be honest with you: this phase is where most people quit. It's not glamorous. You won't be building AI models or impressing anyone at parties. But skip this foundation, and you'll struggle forever.
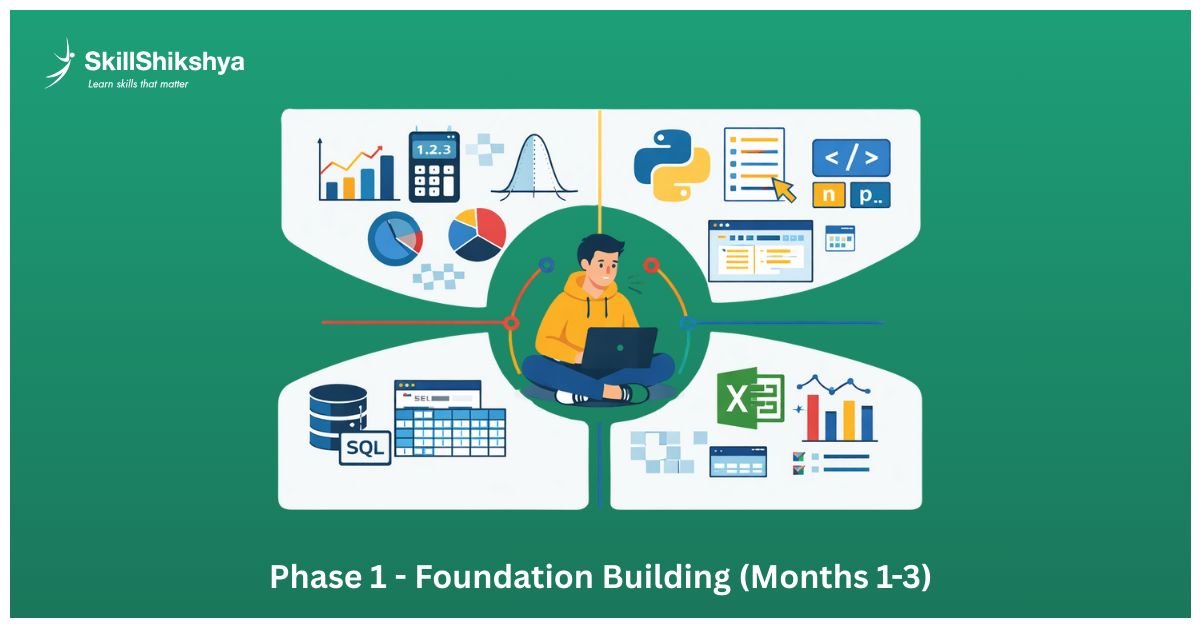
Statistics and Mathematics
You need to understand data before you analyze it. Focus on:
- Descriptive statistics (mean, median, mode, standard deviation)
- Probability basics
- Hypothesis testing
- Correlation and causation
I spent hours on Khan Academy and YouTube making sure I truly understood these concepts. Don't just memorize formulas. Understand why they matter.
Python Programming
Python is your primary weapon. Start with:
- Basic syntax and data types
- Lists, dictionaries, loops, and functions
- Pandas library for data manipulation
- NumPy for numerical operations
I recommend spending 1-2 hours daily on platforms like DataCamp or freeCodeCamp. Build small scripts that solve real problems. I started by analyzing my own expenses in a CSV file. Boring? Yes. Useful? Absolutely.
If you're completely new to programming, I recommend reading about which programming languages are most valuable for your career path to understand how Python compares to other options and why it's the foundation for data analytics.
SQL Mastery
Every business stores data in databases. SQL lets you talk to these databases. Learn:
- SELECT statements and filtering (WHERE clause)
- Joins (INNER, LEFT, RIGHT)
- GROUP BY and aggregate functions
- Subqueries and window functions
Practice on platforms like SQLZoo or Mode Analytics. Try to solve at least 50 problems before moving forward.
Excel and Visualization Basics
I know what you're thinking: "Excel? Really?" Yes. Most Nepali businesses still run on Excel. Master:
- PivotTables and VLOOKUP
- Basic charts and graphs
- Data cleaning techniques
- Power BI or Tableau basics
Create a simple sales dashboard for a fictional store. Make it professional enough that you'd show it in a job interview.
Reality Check: This phase took me closer to 4 months because I was working full-time. Don't rush it. Better to spend an extra month building solid foundations than to struggle for years with weak basics.
Phase 2 - Core Analytics Skills (Months 4-6)
This is where things get exciting. You're moving from "I can code" to "I can solve business problems."
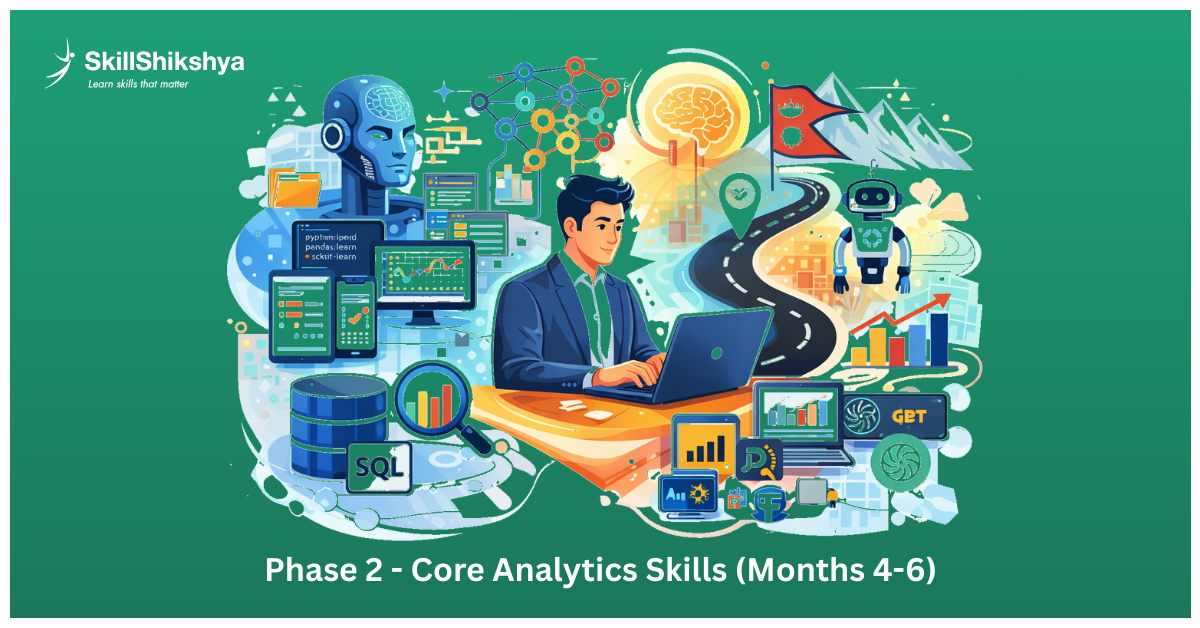
Data Visualization Storytelling
Data without a story is just numbers. Learn to:
- Choose the right chart type for your message
- Design dashboards that executives actually understand
- Use color and layout effectively
- Present insights verbally
I built my first real dashboard analyzing Nepal's tourism data from the government portal. It wasn't perfect, but it told a story. That project landed me my first freelance client.
Machine Learning Fundamentals
Start with supervised learning:
- Linear regression for predictions
- Logistic regression for classification
- Decision trees and random forests
- Model evaluation (accuracy, precision, recall, F1-score)
Use the Scikit-learn library in Python. The key is understanding when to use which algorithm and why. I spent weeks on this, breaking down each algorithm's logic.
AI-Powered Analytics Tools
This is where 2026 differs from 2023. Tools now have built-in AI features:
- Power BI's AI visuals and Q&A
- Tableau's Ask Data feature
- Python libraries with AutoML (H2O.ai, PyCaret)
- ChatGPT for data analysis assistance
Learn prompt engineering. I use ChatGPT daily to explain complex SQL queries, debug Python code, and generate analysis frameworks. Beyond traditional analytics software, there are dozens of AI-powered tools that can dramatically accelerate your workflow – from automated data cleaning to natural language query generation.
Real Projects
Theory means nothing without application. Build:
- Sales Dashboard: Use dummy retail data or scrape real e-commerce data
- Customer Segmentation: Cluster customers based on purchasing behavior
- Marketing Analysis:Analyze which channels drive conversions
Put these on GitHub. Make them public. Write detailed README files explaining your process.
Phase 3 - Advanced AI Integration (Months 7-12)
By month 7, you should be comfortable with data fundamentals. Now we're building predictive systems that businesses actually pay for.
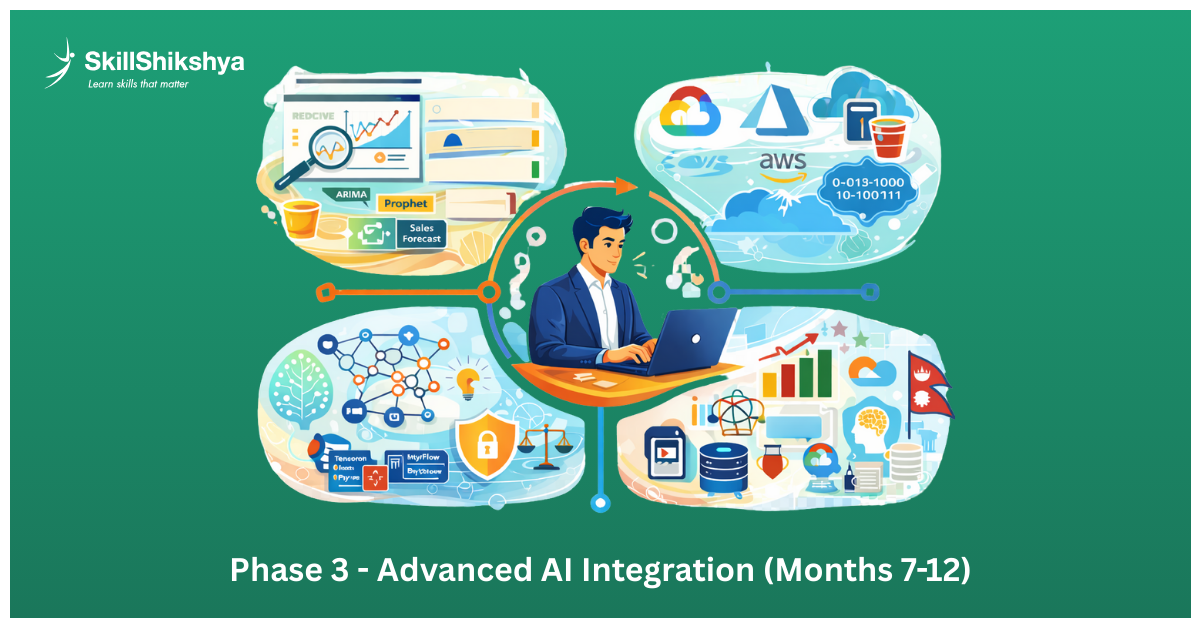
Predictive Modeling and Forecasting
This is where the money is. Learn:
- Time series analysis (ARIMA, Prophet)
- Customer Lifetime Value (CLV) modeling
- Churn prediction
- Sales forecasting with multiple variables
I built a churn prediction model for a telecom company that saved them millions in retention costs. That single project established my reputation.
Cloud Platforms
Most serious analytics happens in the cloud now. Get familiar with:
- Azure Machine Learning for model deployment
- Google Cloud AI Platform for scaling
- AWS S3 for data storage
- Cloud-based notebooks (Google Colab, Azure Notebooks)
Free tiers exist for all of these. Use them.
Deep Learning (Optional But Valuable)
Not every role needs deep learning, but understanding the basics opens doors:
- Neural Networks Fundamentals
- TensorFlow or PyTorch basics
- When to use deep learning vs traditional ML
- Transfer learning for practical applications
I only dove deep into this when a project required image recognition. Know enough to have informed conversations.
Ethics and Governance
This matters more than most people realize:
- Understanding AI bias in models
- Data privacy and GDPR-style compliance
- Fairness testing in algorithms
- Responsible AI practices
I've seen models fail spectacularly because they were biased. Learn to audit your own work.
Industry-Specific Applications
Start specializing based on Nepal's market needs:
- Finance: Credit scoring, fraud detection, risk assessment
- Retail: Inventory optimization, demand forecasting
- Healthcare: Appointment prediction, resource allocation
- Marketing:Campaign ROI, customer targeting
Pick one industry and go deep. Become the go-to person for that domain.
Phase 4 - Expert Level & Specialization (Month 12+)
Congratulations! You've reached the point where you're not just learning. You're innovating.
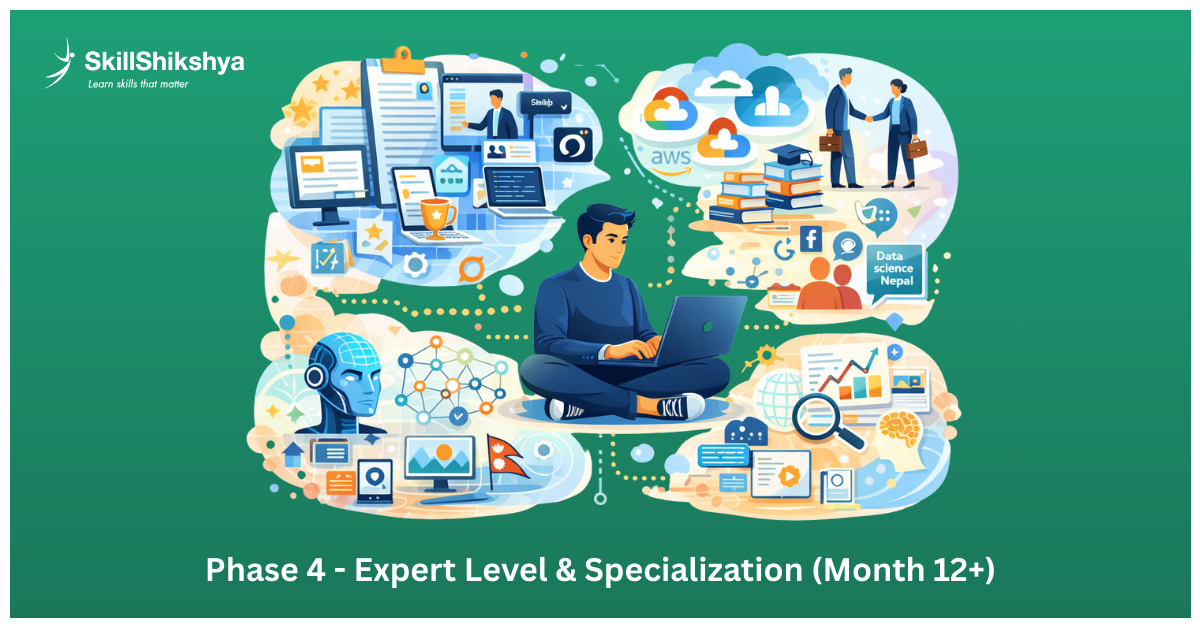
Portfolio Building
Your portfolio is your passport to better opportunities. Include:
- 5-7 diverse projects showing range
- Clear problem statements and solutions
- Code on GitHub with documentation
- Case studies with business impact metrics
- Video presentations or blog posts explaining your work
I got my current position because my portfolio demonstrated I could solve real business problems, not just complete tutorials.
Continuous Learning Strategy
The field evolves monthly. Stay current by:
- Following analytics blogs (Towards Data Science, Analytics Vidhya)
- Attending local meetups (Data Science Nepal, AI Saturdays)
- Taking specialized courses on emerging tools
- Contributing to open-source projects
- Reading research papers (start with summaries)
I dedicate 5 hours weekly to learning new techniques and tools.
Specialization Paths
By now, choose your niche:
- Natural Language Processing: Text analysis, sentiment analysis, chatbots
- Computer Vision: Image recognition, video analysis
- Forecasting Specialist: Time series expert for finance/retail
- Marketing Analytics: Attribution modeling, customer journey analysis
- Business Intelligence:Dashboard expert, reporting specialist
I chose predictive modeling for business applications. It matched market demand with my interests.
Networking and Community
Your network determines your net worth:
- Join the Data Science Nepal community on Facebook
- Attend conferences (even virtual ones)
- Connect with professionals on LinkedIn
- Offer to help startups with analytics (often leads to paid work)
- Start mentoring beginners (teaching solidifies your knowledge)
My best opportunities came through networking, not job portals.
Essential Business Data Analysis Tools You'll Master
Let me walk you through the tools that I use weekly:
- Power BI and Tableau: These are your primary visualization platforms. I prefer Power BI for its Excel integration and DAX language power. Tableau has better aesthetics but a steeper learning curve. Master one thoroughly before dabbling in the other.
- Python Libraries: Pandas and NumPy are non-negotiable. Scikit-learn for machine learning. Matplotlib and Seaborn for visualization. Statsmodels for statistical analysis. Each has specific use cases I've memorized through repetition.
- TensorFlow and PyTorch: For deep learning projects. TensorFlow has better deployment tools. PyTorch has cleaner syntax for research. I use TensorFlow for production work.
- Cloud Platforms: Azure ML for enterprise clients (many Nepali companies use the Microsoft ecosystem). Google Cloud AI for experimental projects with excellent documentation. AWS for scalability when needed.
- SQL Databases: PostgreSQL for most projects. MySQL for older systems. Understanding database design helps you pull data more efficiently.
- Jupyter Notebooks: My daily workspace. Perfect for exploratory analysis, documentation, and sharing work with non-technical stakeholders.
- Git and GitHub: Version control is mandatory. I can't count how many times Git saved my projects when I broke something.
The key isn't knowing every tool. It's knowing which tool solves which problem fastest.
Real Business Analytics Use Cases I've Worked On
Let me share actual projects that paid my bills and taught me invaluable lessons:
Customer Segmentation for E-commerce
A Kathmandu-based online retailer had 50,000 customers but treated everyone the same. I used RFM analysis (Recency, Frequency, Monetary) combined with K-means clustering to identify five distinct customer segments. The result? They personalized marketing campaigns, increased repeat purchases by 34%, and boosted revenue by NPR 2.5 million in six months. This project taught me that simple methods often outperform complex ones.
Sales Forecasting for Retail Chain
A retail chain with 12 stores across Nepal needed better inventory planning. I built a Prophet-based time series model that considered seasonality, festivals, and historical trends. Forecast accuracy improved from 65% to 89%. They reduced inventory costs by 18% while avoiding stockouts during peak seasons. The lesson? Domain knowledge (understanding Nepali festivals and shopping patterns) matters as much as technical skills.
Risk Prediction for Microfinance
A microfinance institution was struggling with loan defaults. I developed a classification model using logistic regression and random forests, incorporating borrower demographics, loan history, and behavioral data. The model predicted defaults with 82% accuracy, allowing them to adjust lending criteria. This saved them approximately NPR 15 million annually in bad loans. Here, I learned that explainability matters more than accuracy when dealing with financial decisions.
Marketing Campaign Optimization
A digital marketing agency running Facebook and Google ads for multiple clients couldn't figure out which campaigns drove actual sales. I built an attribution model that tracked the customer journey from first click to purchase. We discovered that Facebook ads were getting all the credit, but Google Search was actually initiating most conversions. Budget reallocation increased ROI by 45% across their client portfolio. This project showed me that correlation isn't causation, and multi-touch attribution is crucial.
These weren't academic exercises. Each project had real stakes, tight deadlines, and demanding clients. That's where real learning happens.
Common Mistakes to Avoid (I Made These So You Don't Have To)
Skipping Statistics Foundation
I once built a beautiful dashboard with completely wrong insights because I didn't understand sampling bias. I had to redo the entire project. Learn statistics properly. Understand confidence intervals, p-values, and when correlation means nothing. It's painful upfront, but saves embarrassment later.
Ignoring Business Context
Early in my career, I built a complex neural network to predict sales when a simple linear regression would have worked better and been easier to explain. Technical sophistication doesn't matter if you can't communicate results to non-technical stakeholders. Always ask: What business problem am I solving?
Tool-Hopping Without Mastering Fundamentals
I wasted months learning five different visualization tools superficially instead of mastering one deeply. Jack of all trades, master of none. Pick your core stack (Python + SQL + Power BI worked for me) and become excellent at it. You can always learn new tools later.
Neglecting Soft Skills
Being technically brilliant means nothing if you can't explain insights to executives who don't know what a p-value is. I learned this the hard way when my perfectly accurate model was rejected because I couldn't communicate its business value. Practice storytelling. Learn to present. Develop business acumen.
Perfectionism Paralysis
I delayed launching my first portfolio project for months because it wasn't "perfect enough." Nobody cares about perfection. They care about results. Ship your work. Get feedback. Iterate. Done is better than perfect.
I kept my early projects private out of fear of judgment. Big mistake. When I finally started sharing work on LinkedIn and GitHub, opportunities flooded in. Your imperfect portfolio attracts more opportunities than your invisible perfect work.
How to Build Your Data Analytics Portfolio in Nepal
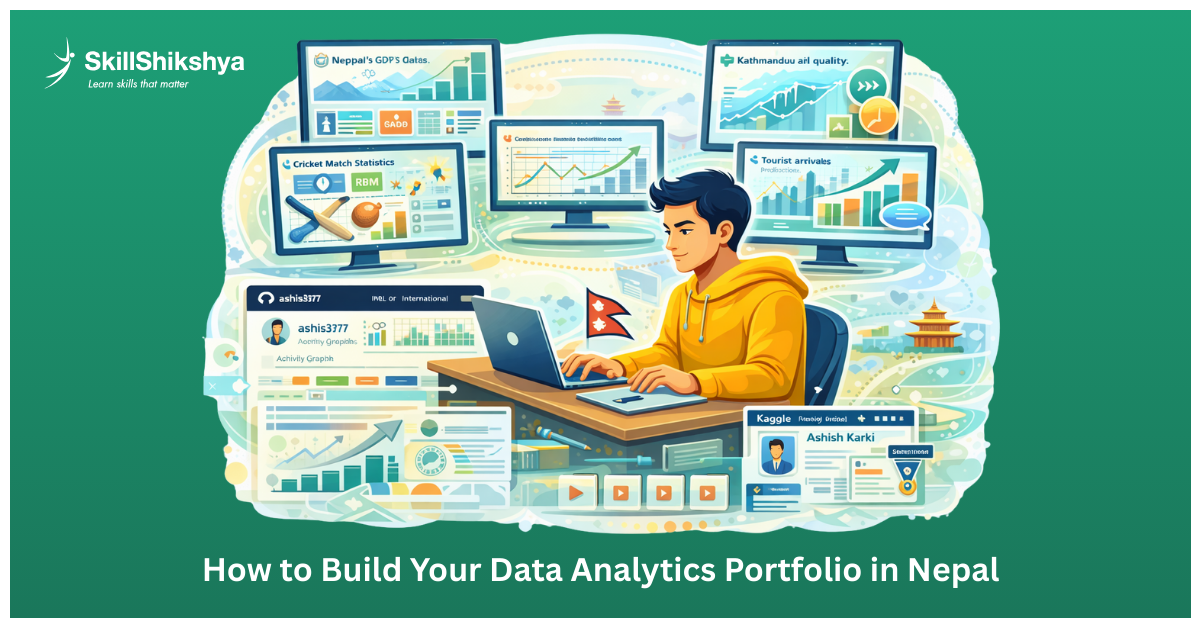
Your portfolio is your proof of skill. Here's exactly how I built mine:
Project Ideas for Beginners
Start with publicly available data:
- Analyze Nepal's GDP data from Nepal Rastra Bank
- Visualize Kathmandu's air quality trends
- Predict tourist arrivals using historical data
- Analyze cricket match statistics (IPL or international)
- Study e-commerce reviews sentiment (scrape from Daraz)
Each project should have: a clear problem statement, a data source, a methodology, visualizations, and actionable insights.
Where to Showcase Your Work
I use multiple platforms:
- GitHub: All code with detailed README files
- Medium or Personal Blog: Write case studies explaining your process
- LinkedIn: Post project summaries with key visualizations
- Kaggle: Participate in competitions, share notebooks
- YouTube (optional):Create video walkthroughs of your projects
The more visible you are, the more opportunities you find.
What Employers Actually Look For
After reviewing 50+ portfolios for hiring, here's what stands out:
- Projects solving real business problems (not just Titanic survival prediction)
- Clean, documented code that others can understand
- Clear communication of methodology and results
- Evidence of end-to-end thinking (data collection to deployment)
- Demonstration of business impact (saved costs, increased revenue)
One strong business-focused project beats ten tutorial reproductions.
Freelancing Opportunities
Nepal's freelance market is growing. I started on:
- Upwork: Built an initial reputation with small projects
- Fiverr: Offered specific services (dashboard creation, data cleaning)
- Local Networks: Posted in business groups on Facebook
- Direct Outreach:Contacted Nepali startups offering free initial analysis
My first paid project was just NPR 5,000 for a simple dashboard. Six months later, I was charging NPR 50,000+ per project.
While building your portfolio, you can start monetizing your skills early. I've written extensively about practical ways students in Nepal are earning money online using their developing data skills – from freelance dashboard creation to data entry automation.
Learning Resources Available in Nepal
Free Online Courses
I built my foundation without spending much:
- Coursera: Google Data Analytics Certificate (financial aid available)
- DataCamp: The first chapter of every course is free
- Khan Academy: Statistics fundamentals
- freeCodeCamp: Python and data visualization
- YouTube:StatQuest for statistics, Corey Schafer for Python
Paid courses aren't necessary initially. Master free resources first.
Local Training Centers
If you prefer classroom learning:
- Skill Shikshya: Practical business analytics training ( best IT institute in Nepal )
- Broadway Infosys (Kathmandu): Data analytics bootcamp
- CSIT colleges offering data science courses
- Uptoskills: Weekend workshops
I've guest-lectured at a few of these. Quality varies, so ask for alumni feedback before enrolling.
Communities and Meetups
Join these groups:
- Data Science Nepal (Facebook group with 15,000+ members)
- Kathmandu Tech Meetups (monthly gatherings)
- AI Saturday Kathmandu (weekend study groups)
- LinkedIn local Nepal tech groups
I found my first mentor through Data Science Nepal. Community matters.
Practice Platforms
Sharpen your skills on:
- Kaggle: Competitions and datasets
- HackerRank: SQL and Python challenges
- LeetCode: Algorithmic problem-solving
- DataCamp: Interactive exercises
- Stratascratch:Real interview questions from tech companies
I spent three months on Kaggle before feeling confident in my modeling skills.
Future of Data Analytics in Nepal (2026 and Beyond)
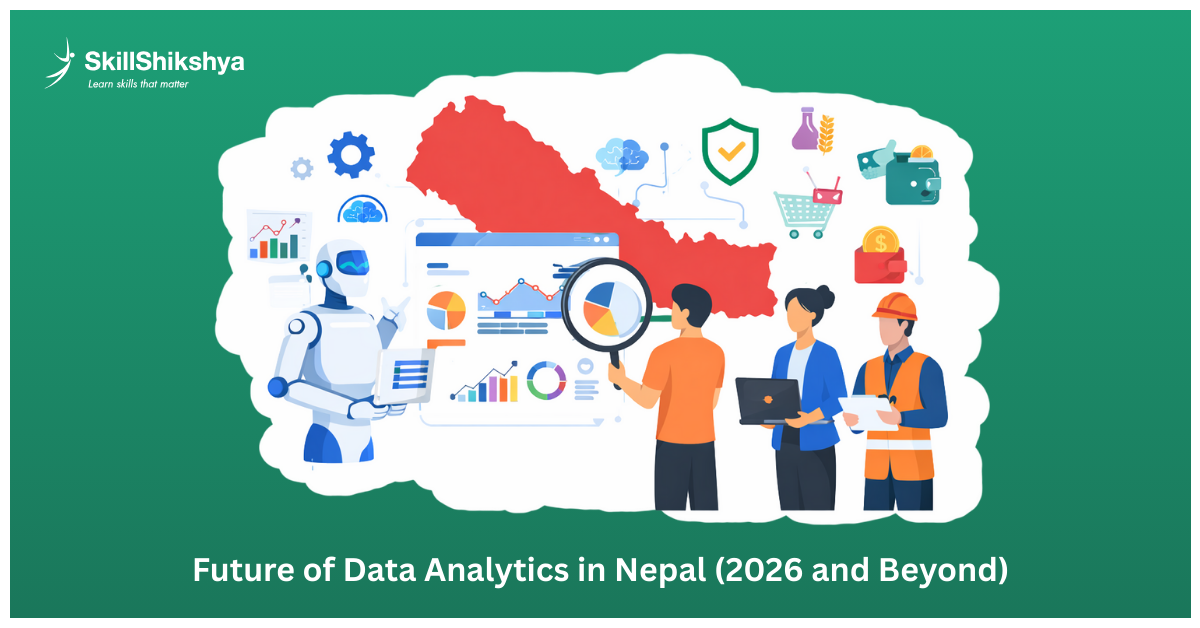
Based on my industry observations and conversations with hiring managers, here's what's coming:
AI Automation Trends
Routine reporting is getting automated. Tools like Power BI's natural language queries and automated insights mean junior analysts need to move up the value chain. Focus on: interpretation, strategy, and complex problem-solving. The future isn't doing analysis; it's knowing what analysis to do.
Emerging Job Roles
New positions I'm seeing in Nepal:
- ML Operations Engineer (deploying and monitoring models)
- Analytics Translator (bridge between tech and business)
- AI Ethics Specialist (ensuring responsible AI)
- Citizen Data Scientist (business users with analytics skills)
Traditional "data analyst" roles are evolving. Adapt or get left behind.
Skills That Will Remain Valuable
What won't be automated:
- Critical thinking and problem formulation
- Business domain expertise
- Communication and storytelling
- Ethical judgment
- Creative analytical approaches
Technical skills have a half-life of 2-3 years. Soft skills compound forever.
Industry Transformation
Sectors that will need analytics talent most:
- Fintech: Digital payments and lending are exploding
- E-commerce: Competition demands data-driven decisions
- Healthcare: Medical data analysis is just beginning
- Agriculture: Precision farming needs data scientists
- Government:Policy decisions are increasingly data-informed
Position yourself in growing sectors for maximum opportunity.
The analysts who thrive in 2026 and beyond will be those who combine technical skills with business acumen and adapt quickly to new tools.
Your 30-Day Action Plan to Start Today
Enough reading. Here's what to do right now:
Week 1-2: Foundation Sprint
Day 1-3: Set up your environment
- Install Python and Anaconda
- Create a GitHub account
- Set up Jupyter Notebook
- Join the Data Science Nepal community
Day 4-7: Statistics basics
- Complete Khan Academy statistics course
- Practice calculating mean, median, and standard deviation manually
- Understand probability fundamentals
Day 8-14: Python essentials
- DataCamp's Introduction to Python course
- Write 10 small scripts solving daily problems
- Learn Pandas basics with simple datasets
Week 3-4: First Project
Day 15-18: Data collection and cleaning
- Find a dataset that interests you (Kaggle, government portals)
- Clean it using Pandas
- Handle missing values and outliers
Day 19-25: Analysis and visualization
- Perform exploratory data analysis
- Create 5 meaningful visualizations
- Write insights in simple language
Day 26-30: Documentation and sharing
- Write a clear README for your project
- Upload to GitHub
- Share on LinkedIn with key findings
Measuring Progress
Track these metrics:
- Code commits per week
- Projects completed
- Concepts mastered
- Job applications sent
- Network connections made
I used a simple spreadsheet to track my progress. Seeing the numbers grow kept me motivated during tough weeks.
Next 60 Days
After your first 30 days:
- Months 2-3: SQL mastery + build second portfolio project
- Apply the roadmap phases systematically
- Join one local meetup or online community event
- Start applying for junior positions or freelance gigs
The key is consistency. One hour daily beats eight hours on Sunday.
Conclusion - Your Journey Starts Now
I started with zero analytics knowledge and built a career that exceeded my expectations. Nepal's data analytics market is at an inflection point. Companies need skilled professionals desperately, but traditional education hasn't caught up.
That's your opportunity.
You don't need a computer science degree. You don't need expensive courses. You don't need to be a math genius. You need curiosity, persistence, and the willingness to learn in public.
The roadmap I've shared isn't theory. It's the exact path I walked and the path I see successful analysts following today. Will it be easy? No. Will it be worth it? Absolutely.
Start with the 30-day action plan today. Not tomorrow. Not next Monday. Today. Join the Data Science Nepal community. Download Python. Pick your first dataset. Write your first line of code.
Three years from now, you'll either have three years of experience and a thriving career, or three years of wishing you had started.
The choice is yours. The roadmap is here. The market is ready.
What are you waiting for? Enroll Now
Frequently Asked Questions
1. What is Business Data Analytics with AI?
2. Is data analytics in demand in Nepal?
3. Do I need a technical or IT background to start?
4. What skills will I learn in this course?
5. How long does it take to become job-ready?
6. What kind of salary can I expect in Nepal?
7. What tools are used in business data analytics?
8. Will I work on real projects?
About Author: