Google Sheets vs Excel: Which Should You Learn for Data Analytics? | Skill Shikshya
If you have started exploring data analytics as a career, you have almost certainly hit this question early: should I learn Google Sheets or Excel first? Both are spreadsheet tools. Both handle data. Both appear constantly in job descriptions. And yet they are built for fundamentally different situations, with meaningfully different skill ceilings, costs, and career implications.
Most articles comparing Google Sheets vs Excel answer the question for a general user someone who just wants to organize a personal budget or track team tasks. This guide answers it specifically for someone learning data analytics, either as a student in Nepal exploring the field or as a working professional trying to build skills that employers actually pay for.
Before diving in, a quick orientation to where this fits in the cluster. For the foundational picture of data analytics as a discipline, our guide on the four types of analysis and how they connect covers the full workflow from data collection to decision. For a practical breakdown of where spreadsheet tools sit alongside more specialized software in a complete analytics toolkit, our piece on how business intelligence tools work in practice covers the broader landscape. If you are ready to start building job-ready skills with real data, our Business Data Analytics with AI Course in Nepal teaches both tools in the context of actual analytical workflows.
Google Sheets vs Excel: The Core Difference in One Paragraph
Google Sheets is a free, cloud-native, browser-based spreadsheet tool built primarily for real-time collaboration and accessibility. Microsoft Excel is a desktop-first, computation-heavy spreadsheet application built for advanced data analysis, complex modelling, and handling large datasets at speed. Both use similar formula logic and produce similar basic outputs. The difference is in ceiling, not floor. For simple tasks, both tools do the job. For serious data analytics work, Excel's depth pulls significantly ahead which is exactly why it dominates the data analytics job market in Nepal and globally.
What is Google Sheets?
Google Sheets is a web-based spreadsheet application launched by Google in 2006 as part of what is now called Google Workspace. It runs entirely in a browser, requires no installation, saves automatically to Google Drive, and allows multiple users to edit the same file simultaneously in real time. For individual users, it is completely free. Business users pay as part of a Google Workspace subscription starting at $6 per user per month. For a complete walkthrough of how Excel handles real analytical tasks from pivot tables to Power Query, our guide on a deeper walkthrough of Excel's analytical capabilities covers every core feature data analysts use day to day.
The core strengths of Google Sheets are accessibility, collaboration, and zero cost of entry. It is the tool most data analytics beginners encounter first because it removes every barrier between opening a browser and starting to work with data immediately.
What is Microsoft Excel?
Microsoft Excel is a desktop spreadsheet application first released in 1985 and now distributed as part of Microsoft 365. It is the most widely used data analysis tool in the world across business, finance, academia, and government. Unlike Google Sheets, Excel runs primarily as an installed desktop application that uses your computer's processor directly, giving it a significant performance advantage when handling large datasets.
Microsoft 365 includes exclusive functions like XLOOKUP, LAMBDA, LET, FILTER, and dynamic arrays all of which are critical for advanced data analytics work. Pricing as of 2026: Microsoft 365 Personal is $6.99 per month or $69.99 per year for individuals; Microsoft 365 Business Basic starts at $6 per user per month for organizations. A limited free version of Excel is also available online at Excel for the Web, though it lacks many of the advanced features that data analysts rely on.
Google Sheets vs Excel: Full Comparison Table
| Factor | Google Sheets | Microsoft Excel |
|---|---|---|
| Cost | Free for individuals | $6.99/month (Personal) or $6/user/month (Business Basic) |
| Platform | Browser-based, any device | Desktop-first (Windows/Mac), also web and mobile |
| Collaboration | Real-time, built-in, seamless | Requires setup; version compatibility issues common |
| Data capacity | ~5 million cells per spreadsheet | Over 1 billion cells; handles millions of rows natively |
| Processing speed | Slower with large datasets | Significantly faster; uses local processor |
| Formula library | ~500 functions | ~500+ functions including advanced statistical tests |
| Advanced analytics tools | Limited; requires add-ons | Power Query, Power Pivot, Solver, built-in statistical tests |
| Data visualization | Basic to intermediate charts | Advanced charts plus intelligent Recommended Charts |
| AI integration | Gemini (still limited in features) | Microsoft Copilot (more advanced, broadly available) |
| Offline access | Requires enabling offline mode | Native offline functionality |
| Learning curve | Low; beginner-friendly interface | Moderate to high; more powerful but more complex |
| Industry adoption | Small teams, startups, NGOs | Banking, finance, enterprise, data analytics roles |
| Nepal job market | Common in NGOs and small businesses | Standard requirement across banking, IT, and analytics roles |
Google Sheets vs Microsoft Excel: Formulas and Functions Compared
Formula compatibility is one of the most confusing parts of the Google Sheets vs Excel debate, because most basic formulas are identical across both tools. Here is the reality broken down clearly.
Formulas that work identically in both:
- SUM, AVERAGE, COUNT, COUNTA, COUNTIF, SUMIF
- VLOOKUP, HLOOKUP, INDEX, MATCH
- IF, IFS, AND, OR, NOT
- LEFT, RIGHT, MID, LEN, TRIM, CONCATENATE
- DATE, TODAY, NOW, YEAR, MONTH, DAY
Google Sheets formulas not available in Excel:
- GOOGLEFINANCE: Pulls live stock and financial data directly into a sheet
- IMPORTRANGE: Imports data from another Google Sheet automatically
- IMPORTHTML and IMPORTDATA: Pulls data from websites and URLs directly
Excel formulas and tools not available or limited in Google Sheets:
- XLOOKUP: A more powerful, flexible replacement for VLOOKUP that handles errors and multiple return values cleanly; not available in Google Sheets natively
- LAMBDA and LET: Allow you to define custom reusable functions within Excel; Google Sheets has no equivalent
- FILTER and SORT as dynamic array functions: Excel's implementation is more powerful and consistent
- Power Query: Excel's built-in ETL (Extract, Transform, Load) tool for connecting to external data sources, cleaning messy data, and automating data preparation; not available in Google Sheets without third-party add-ons
- Power Pivot: Allows Excel to connect to and model multiple large datasets simultaneously, far beyond a standard spreadsheet's capacity
- What-If Analysis (Scenario Manager, Goal Seek, Data Tables): Built-in tools for financial modelling and scenario testing; not available in Google Sheets natively
- Built-in statistical tests: t-Tests, z-Tests, ANOVAs, regression analysis are built directly into Excel's Data Analysis Toolpak; Google Sheets requires a third-party add-on
For data analytics work specifically, Power Query alone is a significant differentiator. It automates the data cleaning and preparation process that consumes the majority of an analyst's time on most real projects. Analysts who know Power Query in Excel consistently deliver work faster than those limited to manual cleaning in Google Sheets.
Is Google Sheets Better Than Excel? The Honest Answer
Is Google Sheets better than Excel? For specific situations, yes. For data analytics as a career, no and that distinction matters for anyone making a learning investment decision.
Google Sheets is genuinely better than Excel for:
- Real-time team collaboration with multiple simultaneous editors
- Accessibility from any device without installation or license cost
- Sharing and publishing data with external partners or stakeholders
- Small teams and NGOs working with modest datasets and limited budgets
- Beginners who need to start working with data immediately at zero cost
Excel is genuinely better than Google Sheets for:
- Handling large datasets of millions of rows without performance degradation
- Advanced data cleaning and preparation through Power Query
- Complex financial modelling, scenario analysis, and statistical testing
- Data visualization with more chart types and the intelligent Recommended Charts feature
- Professional data analytics roles across banking, finance, and enterprise environments
- Integration with Power BI for building dashboards from Excel-prepared data
The fairest summary: Google Sheets wins on accessibility and collaboration. Excel wins on analytical depth, performance, and career relevance in data analytics.
Is Google Sheets as Good as Excel for Data Analytics Work?
This is a more specific question than the general comparison, and it deserves a direct answer. Is Google Sheets as good as Excel for data analytics work? No, for three concrete reasons:
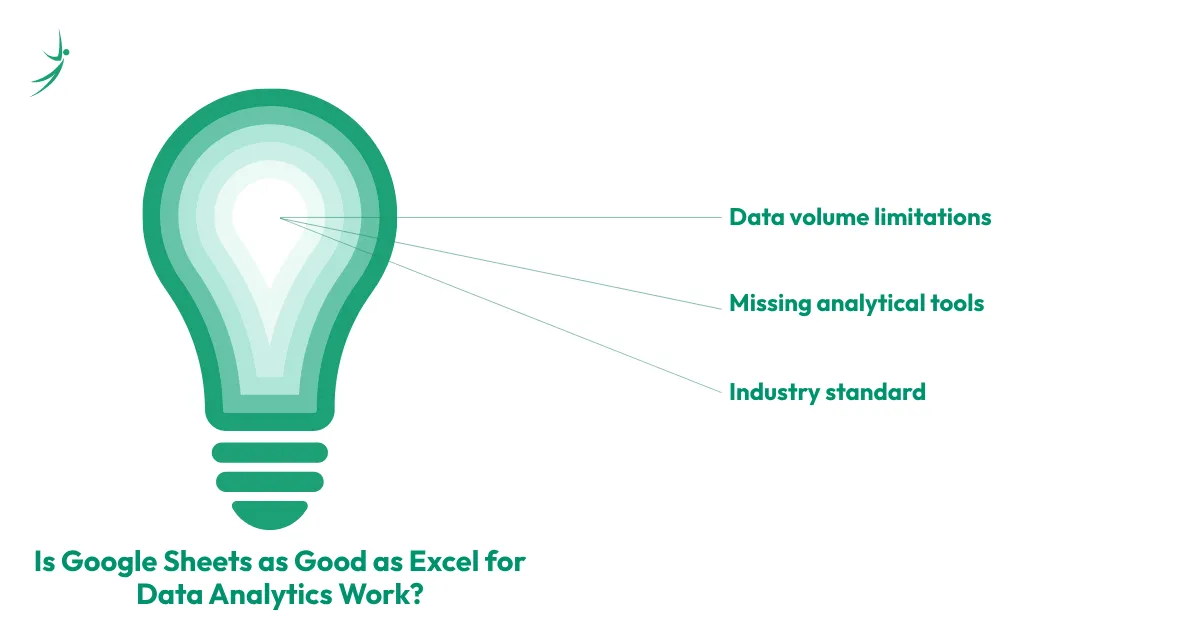
1. Data volume limitations
Google Sheets handles approximately 5 million cells per spreadsheet. A commercial bank in Kathmandu running transaction analytics, a telecom operator analyzing subscriber data, or an e-commerce company modeling customer lifetime value regularly works with datasets that exceed this limit. Excel handles these without issue.
2. Missing analytical tools
Power Query, Power Pivot, built-in statistical tests, and What-If Analysis are standard tools in professional data analytics workflows. Their absence from Google Sheets means analysts working in Sheets must either use workarounds, install third-party add-ons (which create security and maintenance risks), or switch to Python for tasks that Excel handles natively.
3. Industry standard
Nepal's banking, telecom, and IT outsourcing sectors the three most active hirers of data analysts locally specify Excel in job requirements, not Google Sheets. An analyst proficient in Excel Power Query and advanced formulas is more immediately valuable to these employers than an analyst who knows Google Sheets deeply.
Google Sheets vs Excel Formulas: The Practical Difference for an Analyst
To make the formula comparison concrete, here is the same analytical task performed in each tool and what the difference looks like in practice.
- Task: Look up a customer's account balance from a database and return a meaningful result even if the customer is not found.
In Google Sheets using VLOOKUP:
=IFERROR(VLOOKUP(A2, CustomerData!A:B, 2, FALSE), "Not Found")
In Excel using XLOOKUP:
=XLOOKUP(A2, CustomerData!A:A, CustomerData!B:B, "Not Found")
The Excel version is cleaner, more readable, handles the error natively without wrapping in IFERROR, and works correctly when data is added to the left of the lookup column a common real-world scenario that breaks standard VLOOKUP but that XLOOKUP handles automatically.
- Task: Clean and standardize a column of transaction dates that arrived in multiple inconsistent formats from a data export.
In Google Sheets: manual formula-by-formula cleaning, often requiring multiple helper columns and TRIM, LEFT, MID, SUBSTITUTE combinations built step by step.
In Excel using Power Query: connect to the data source, apply a single "Change Type" transformation, and have the transformation run automatically every time the source data refreshes. What takes an analyst 20 to 30 minutes of formula building in Google Sheets takes two to three minutes in Power Query and does not need to be rebuilt when next month's data arrives.
This is the practical gap. It shows up not in basic tasks where both tools perform identically, but in the messy, high-volume, real-world data work that constitutes the majority of a professional analyst's day.
Google Sheets vs Excel: AI Features in 2026
Both tools have added AI capabilities, and the comparison here mirrors the broader tool comparison: Google Sheets' AI is improving but still catching up, while Excel's Copilot is more mature and deeply integrated.
Microsoft Excel with Copilot allows users to describe what they want in plain English "create a pivot table showing sales by region for Q1" or "find the formula to calculate year-over-year growth" and receive an instant, applied result. Microsoft has integrated Copilot Chat across core apps, including Excel as part of its 2026 Microsoft 365 updates, with the full Copilot experience available as an add-on at $30 per user per month on top of existing subscriptions. For data analysts, Copilot's ability to generate DAX measures, suggest chart types, and explain formula logic in plain language is a meaningful productivity multiplier.
Google Sheets with Gemini offers similar natural-language querying and can generate tables, formulas, and charts from prompts. However, the most advanced Gemini features remain restricted to Google Workspace Labs users, and overall, the AI integration is less mature than Excel's Copilot for complex analytical tasks.
For data analytics professionals in Nepal's job market in 2026, the practical implication is clear: Excel's Copilot is the AI tool you will encounter and be expected to use in professional analytics roles. For a full breakdown of how AI is reshaping every layer of the analytics toolkit not just spreadsheet tools our guide on how AI is reshaping every layer of the analytics toolkit covers the tools, workflows, and career implications in detail.
Pricing: Google Sheets vs Excel Download and Cost Breakdown
One of the most common practical questions is about cost. Here is the complete, current breakdown.
Google Sheets pricing:
- Individual use: completely free with a Google account
- Google Workspace Business Starter: $6 per user per month (includes Sheets, Docs, Drive, Meet, and all Google apps)
- Google Workspace Business Standard: $12 per user per month
Microsoft Excel pricing (as of August 2026):
- Excel Online (web only): free, with significant feature limitations
- Microsoft 365 Personal: $6.99 per month or $69.99 per year (one user, up to 5 devices, includes all Microsoft 365 apps and 1TB OneDrive)
- Microsoft 365 Family: $9.99 per month or $99.99 per year (up to 6 users)
- Microsoft 365 Business Basic: $7 per user per month (rising from $6 as of July 2026 price increase)
- Microsoft 365 Business Standard: $14 per user per month (updated July 2026)
For individual learners in Nepal, the practical cost comparison is: Google Sheets is free, and Microsoft 365 Personal at approximately NPR 900 to NPR 1,000 per month gives you the full Excel desktop application. For students and early-career professionals, Microsoft does offer discounted or free Microsoft 365 Education access through educational institutions worth checking with your institute before paying for a personal subscription.
Google Sheets vs Excel: Who Uses Each Tool in Nepal
Understanding which tool Nepal's employers actually use is more relevant than any abstract feature comparison.
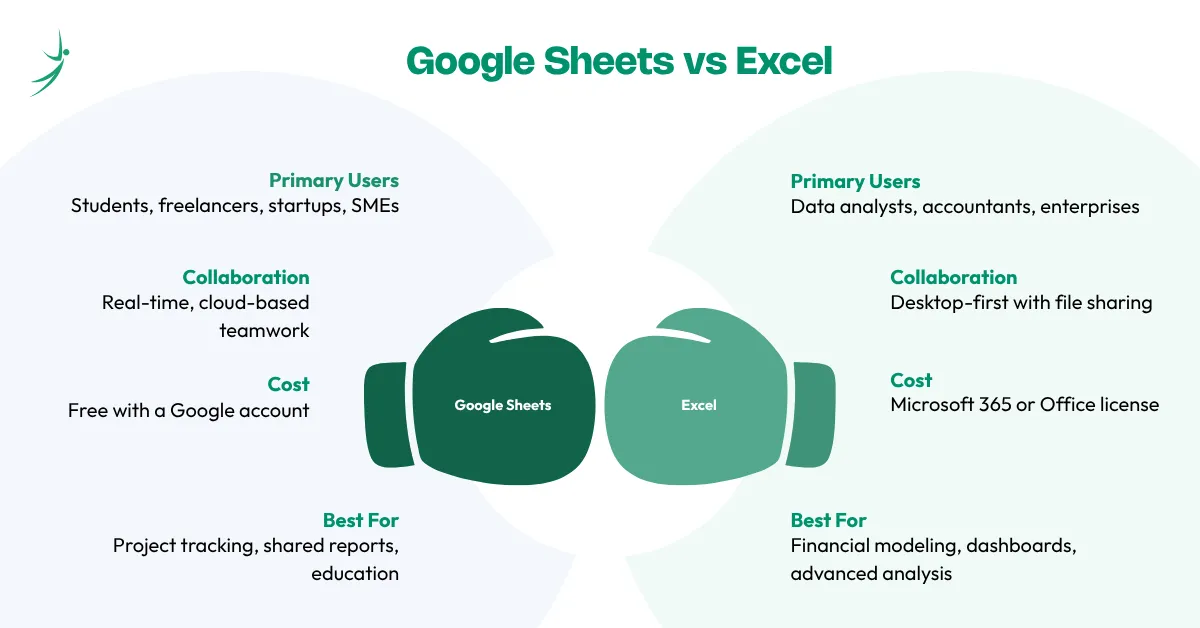
Google Sheets is commonly used by:
- NGOs and development organizations managing program data collaboratively across field offices
- Small businesses and startups tracking operations, expenses, and basic reporting
- Marketing teams managing content calendars, campaign trackers, and social media data
- Teams working remotely with distributed members in different locations
- Individuals managing personal finances, project lists, or freelance client tracking
Microsoft Excel is the standard in:
- Nepal's commercial banking sector financial analysis, loan portfolio reporting, regulatory submissions
- Telecom operators subscriber data analysis, revenue reporting, network performance tracking
- IT outsourcing companies client deliverables, data cleaning, reporting automation
- Large FMCG and manufacturing companies inventory management, supply chain analysis, financial modeling
- Data analytics roles across every sector that specifically requires analyst skills the job descriptions use Excel, not Sheets
This is not a matter of preference. It is a matter of industry standard. If you are targeting a data analytics career in Nepal's banking, IT, or telecom sectors which represent the strongest local job market for analysts Excel is the non-negotiable starting point. If you are also weighing which analytics role to target whether that is a data analyst or a business analyst position our guide on understanding which analytics role fits your goals breaks down the difference clearly.
Google Sheets vs Excel: Which Should You Learn First for Data Analytics?
Here is the direct answer for different situations a Nepal-based learner might be in.
Learn Google Sheets first if:
- You are an absolute beginner who has never worked with spreadsheets at all and need the lowest-friction starting point to build basic data literacy
- You are working in an NGO or small business environment where Google Sheets is already the team's tool of choice
- You have zero budget for software and need to start immediately at no cost
Learn Excel first if:
- You are targeting a data analytics career in Nepal's banking, telecom, IT outsourcing, or enterprise sectors
- You want to maximize your employability in the shortest time Excel appears in more Nepal data analytics job descriptions than any other tool
- You are building toward Power BI, since Excel and Power BI share the same data modeling concepts and Power Query workflow
- You want to learn the full data analytics toolstack, since Excel is the bridge between raw data handling and more advanced tools like SQL and Python
Learn both if:
- You are in a role that uses Google Sheets daily and want to build on that foundation toward more advanced analytics
- You need collaboration features for current work while also building Excel skills for career advancement
- You want the complete picture of how spreadsheet tools fit into a broader data analytics workflow
The honest recommendation for most Nepal-based learners targeting a data analytics career: start with Excel. Google Sheets is easier to pick up on your own once you have Excel fundamentals. The reverse is harder Google Sheets habits can actually slow down the process of learning Excel's more powerful interface and workflows.
How Spreadsheets Fit Into the Broader Data Analytics Roadmap
Understanding where Google Sheets and Excel sit within the complete data analytics learning journey is as important as knowing how the two tools compare with each other.
For a complete picture of how spreadsheet skills connect to SQL, Python, and visualization tools in a structured learning sequence, our guide on building a practical path into data analytics maps the full roadmap from zero to job-ready. For a breakdown of how Excel-prepared data connects to dashboard tools specifically, our guide on turning raw data into visual stories covers how visualization layers on top of spreadsheet foundations.
The short version of where spreadsheets sit in the full data analytics roadmap:
- Excel and Google Sheets: The starting point for data literacy, formula logic, and basic analysis
- SQL: The next critical step, for querying and preparing data from actual databases rather than manual spreadsheets
- Python: For automation, advanced statistical analysis, and integration with machine learning workflows
- Power BI or Tableau: For building the dashboards and visualizations that communicate analytical findings to stakeholders
- AI tools: Used alongside every layer of the above, not as a replacement for foundational skills
Excel is the first step on that roadmap for most data analytics learners, not because it is the most glamorous tool, but because it is the most universally required and the most direct bridge to everything that comes after it.
Conclusion
The Google Sheets vs Excel debate has a clear answer for anyone targeting data analytics as a career: Excel is the professional standard, and it is worth the learning investment and the modest subscription cost. Google Sheets is a genuinely excellent tool for collaboration, accessibility, and zero-cost data work but its ceiling in professional analytics contexts is meaningfully lower than Excel's, and Nepal's data analytics employers reflect that reality in their job requirements.
Start with Excel. Learn Power Query alongside the core formulas. Build the skill set that the job market in Nepal's banking, telecom, and IT sectors is actually asking for. And when you encounter Google Sheets in a collaborative work context, you will pick it up quickly because the formula foundations are largely the same.
If you are ready to build Excel, SQL, Python, and Power BI skills together in a structured, project-based program designed around what Nepal's data analytics job market actually requires, explore the Business Data Analytics with AI Course at Skill Shikshya.
Frequently Asked Questions
What is the main difference between Google Sheets and Excel?
Is Google Sheets better than Excel?
Is Google Sheets as good as Excel for data analysis?
Which should I learn first for data analytics in Nepal Google Sheets or Excel?
Are Google Sheets and Excel formulas the same?
How much does Excel cost in Nepal?
Can I use Google Sheets and Excel together?
Which tool is used more in Nepal's data analytics job market?
About Author:

Dhiraj Bashyal is a Machine Learning Engineer at Vrit Technologies, with 3 years of hands-on experience in applied AI and machine learning. He brings that industry experience directly into the classroom, teaching Data Science and Machine Learning at Skill Shikshya, where he helps learners build a practical, project-ready foundation in Python, ML workflows, and real-world data problem-solving.